

Trading Execution Plan
Based on the clear bearish dominance on the 4-hour chart and the post-breakout pullback structure intraday, our strategy today is to short on rallies (trend-following).
Strategy Direction: Short on rallies (Trend-Following)
Trading Signal: Sell
Confidence Rating: 85.00/100.00
- Entry Range: 4000.00 – 4023.00
- Midpoint Entry: 4011.50
- Stop-Loss (SL): 4066.67
- Take-Profit (TP): 3901.17
- Risk-to-Reward Ratio: 1:2.00
I. Fundamental Analysis
- U.S. Political Friction:
- Open disputes erupted among Senate Republicans during a luncheon over military actions in Iran. The Senate passed a resolution limiting the President's war powers by a 50-48 vote. Critics noted that the military operation has dragged on for four months instead of the expected four weeks, failing to hit its targets. Former President Trump responded aggressively, lashing out at fellow Republicans.
- Emergency Funding Stalled:
- The White House has formally requested an $87.6 billion supplemental appropriation from Congress, with roughly $70 billion earmarked for the ongoing costs of operations in Iran. The budget also includes $11 billion in agricultural aid, $1.4 billion for public health responses, and $1 billion for transit station renovations. The proposal is currently facing widespread opposition from both the House and the Senate.
- Energy Shipping Lanes Recovering:
- With progress on the peace talks memorandum, commercial transit through the Strait of Hormuz is gradually resuming. Roughly 20 million barrels of crude oil flowed through the strait over the past 24 hours, pulling international oil prices back down to pre-conflict levels. However, core disagreements persist regarding nuclear inspections, the specific use of unfrozen assets, and Israel’s refusal to fully withdraw its troops.
II. Technical Analysis by Timeframe
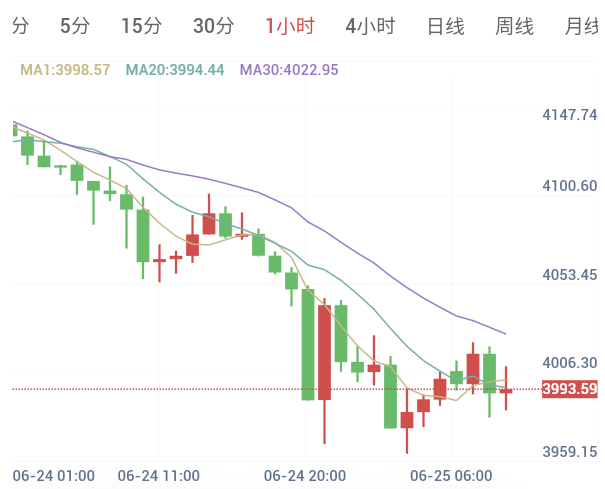
1-Hour Chart (Intraday Short-Term: Neutral)
- Outlook: Short-term price action shows weak consolidation at lower levels. The 1-hour chart exhibits a slight bullish divergence, suggesting an intraday technical rebound or corrective pullback is likely. However, due to a lack of institutional buying support in the fundamentals, the upside momentum of this bounce will likely remain limited.
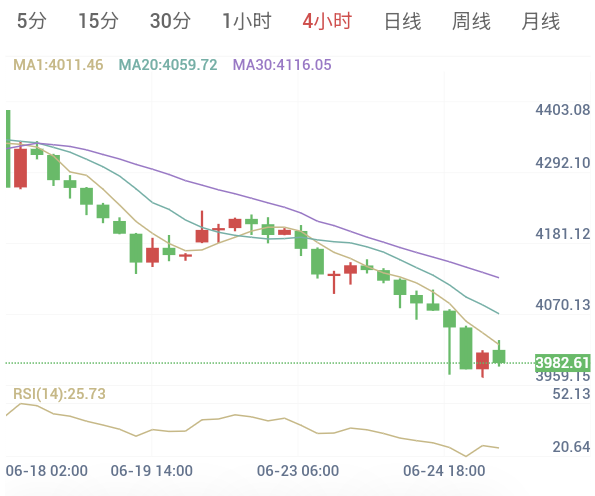
4-Hour Chart (Medium-Term Trend: Sell)
- Outlook: The 4-hour structure is heavily dominated by bearish selling pressure. Gold recently broke below its previous strong support zone at 4023.00 on heavy volume. Downward momentum shows no clear signs of exhaustion or stabilization yet.
- Indicators: RSI has dropped to 25.73, moving into oversold territory.
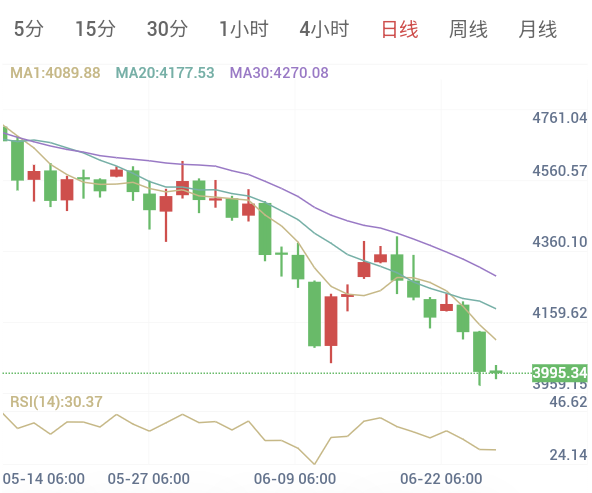
Daily Chart (Medium-to-Long Term: Neutral)
- Outlook: The broader daily trend remains neutral. Although the price is approaching medium-to-long-term oversold boundaries, the daily chart continues to extend downward following a bearish moving average cross. The overall structural pressure remains firmly intact.
- Indicators: RSI sits at 30.30, nearing the oversold threshold.
III. Key Price Levels
Key Resistance:4023.00
Key Support1 :3964.00
Key Support 2:3901.17
IV. Execution Details
Position Management
Strictly avoid heavy exposure today. Keep your risk light, with total capital allocation capped under 5%. If gold successfully breaks below the key 3964.00 support level, you may look to pyramid into short positions with small, incremental lots.
Emergency Risk Control
Lock in 4066.67 as your hard intraday line in the sand. If a strong counter-rally breaks above this level on heavy volume, it means the current 4-hour bearish structure has been compromised. All short positions must be stopped out unconditionally. Step aside and watch from the sidelines.
Risk Disclaimer:
Trading financial markets involves unpredictable risks, including the potential loss of principal. This analysis is for informational purposes only and does not constitute direct investment advice. Investors should make independent decisions based on their own risk tolerance.