

Market Fundamentals Analysis
- Remnants of Freezing Cold US June Non-Farm Payrolls Continue to Digest: With June job additions printing at a meager 57,000 (less than half of market estimates) and a cumulative 74,000 downward revision for the prior two months, the labor market is showing a distinct loss of expansionary momentum. On July 6, the market continued to process this shock. The CME FedWatch Tool showed the probability of the Fed keeping rates unchanged in July climbed to 77%, while September rate hike odds dropped significantly. As the US Dollar Index extended its weak run and the 10-year US Treasury yield hovered at low levels, marginal valuation pressures on non-yielding precious metals eased. Spot gold spiked to the $4,200 per ounce threshold during the Asian session, while spot silver simultaneously rallied near $63 per ounce, tagging a near two-week high.
- J.P. Morgan and Other International Investment Banks Release Bullish Signals: On July 6, J.P. Morgan released its latest outlook, maintaining its long-term structural bullish call on gold. The bank forecasts an average price of $4,300 per ounce for the third quarter of 2026 and $4,500 per ounce for the fourth quarter, anticipating that prices will recover following a brief period of near-term consolidation. HSBC and Royal Bank of Canada (RBC) shared similar views, noting that pullbacks to or below the $4,000 macro floor will attract substantial buy-the-dip institutional demand. They argued that the market's pricing of aggressive rate hike expectations has been overextended, guiding speculative capital back into the precious metals complex and providing strong sentiment support for the rebound.
- Fragility Persists in US-Iran Negotiation Process: Market headlines on July 6 indicated that while indirect talks between the US and Iran in Doha are progressing, the two sides remain divided on core issues such as transit fees through the Strait of Hormuz and the timeline for lifting sanctions. The speaker of the Iranian parliament openly noted realistic difficulties in reaching a consensus, meaning sporadic conflict risks in the Middle East are not entirely resolved. Lingering geopolitical uncertainties continue to place a floor under gold safe-haven demand, capping the downside for precious metals. Concurrently, international oil prices are consolidating at low levels without adding noticeable upward pressure to inflation expectations, creating a mixed, range-bound backdrop.
- Global Central Bank Gold Demand Remains Elevated, Building an Ironclad Floor: The latest data from the World Gold Council shows global central banks net-purchased 41 metric tons of gold in May, marking the second-highest monthly reading this year, with China and Poland continuing to lead the accumulation rankings. OMFIF survey data indicates that global central banks are planning net reductions in US dollar assets for the first time while simultaneously ramping up gold reserve allocations. Under the secular trend of de-dollarization, gold's strategic reserve value remains highly prominent. This official, long-term institutional buying acts as a resilient buffer; even if short-term interest rate fluctuations trigger volatility, deep downward expansions for gold and silver remain heavily constrained by low-level bids.
Gold Technical Analysis
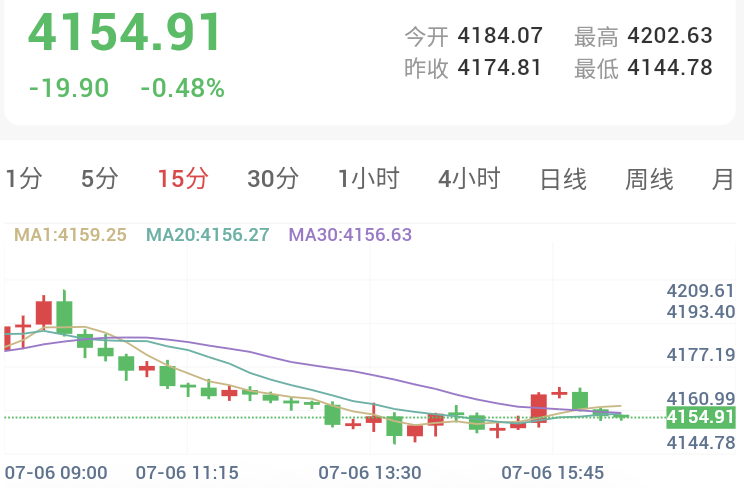
- Daily Chart: Gold opened the Asian session today at $4,184.07 per ounce, gapping higher before trading lower within a wide, volatile range. Currently, the moving averages remain in a dead cross formation, maintaining a broader bearish structure. Keep a close watch on whether today's closing price can effectively break below the 20-period moving average; a clean break could open up structural opportunities to build medium-term short positions.
- Intraday Short-Term (15-Minute Chart): Moving averages are currently in a bearish alignment, with the price tracking below the 20-period moving average. Wait for the price to retest the moving averages and enter short on a clean breakout confirmation.
Silver Technical Analysis
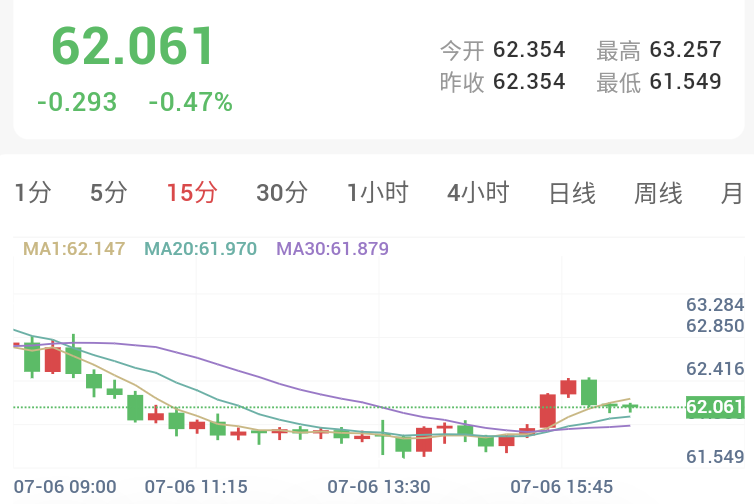
- Daily Chart: Silver opened today at $62.354 per ounce, minorly gapping higher before drifting lower, pulling back to test the daily 20-period moving average before resuming its decline. This indicates that the recent relief rally may have run its course. On the daily timeframe, the moving averages remain in a dead cross alignment, keeping the broader macro direction tilted to the downside. Patiently wait for a fresh medium-term short prospectus to materialize.
- Intraday Short-Term (15-Minute Chart): Moving averages are currently showing a bearish alignment, with the price pinned below the 20-period moving average. Wait for the price to pop back above the 20-period moving average and enter short on a clean break back down.
Risk Warning
Trading markets carry unpredictable risks, including but not limited to the loss of principal. This analysis is for reference only and does not constitute direct investment advice. Investors should make independent judgments and autonomous decisions based on their own risk tolerance.