

Market News Analysis
July FOMC Meeting Officially Convenes: The Federal Reserve's FOMC rate-setting meeting officially began on July 28. While baseline market expectations anticipate interest rates holding steady, the implied probability of a 25-basis-point hike in July has surged from 13% a week ago to 38%, with the probability of a September hike exceeding 70%. Internal divisions between hawks and doves have widened noticeably. Voting members Lorie Logan (Dallas Fed) and Beth Hammack (Cleveland Fed) have openly advocated for rate hikes, whereas New York Fed President John Williams and others favor awaiting September economic data. Heightened policy uncertainty has prompted investors to curb risk exposure, lifting the US Dollar Index to 101.55—a near one-month high—while 10-year Treasury yields remain elevated, sustaining high opportunity costs for non-yielding precious metals.
Fragile US-Iran Ceasefire Experiences Friction: On July 28, President Donald Trump stated that negotiations with Iran were progressing well toward a potential deal. However, Iran's foreign ministry publicly denied active talks with Washington. Concurrently, Houthi forces launched strikes on Saudi energy infrastructure, while Saudi Arabia, Jordan, and Iraq all reported drone incursions, signaling severe risks of ceasefire breakdown. Affected by these shifting dynamics, international energy prices entered consolidation following an 8% plunge in the prior session. Safe-haven geopolitical bids clashed with disinflationary sentiment from lower oil prices, leaving gold and silver without clear directional drivers and locking prices in a rangebound pattern.
Profit-Taking Compounds Technical Breakdown Pressure: Long positions engaged in concentrated profit-taking on July 28, combined with pre-meeting de-risking and valuation pressure from a firming US dollar. This confluence of bearish factors drove gold and silver steadily lower from recent bounce peaks. Given silver's industrial properties and smaller market size, its volatility elasticity significantly exceeded gold's, resulting in a substantially steeper intraday drop.
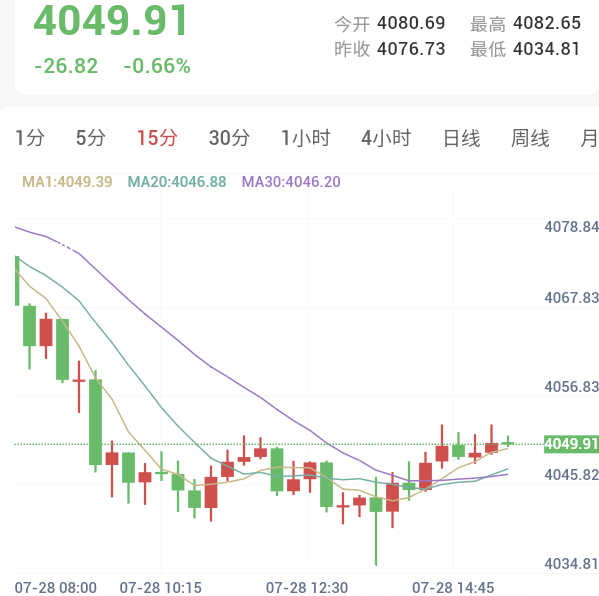
Gold Technical Analysis
Daily Chart: Gold opened at $4,080.69 per ounce during the Asian session, returning to a bearish stance to touch an intraday low of $4,034.81 per ounce. Moving average systems remain in a bearish death cross. Short positions initiated near $4,049.00 can be held, with stop-loss protection maintained at the previous peak of $4,166.00.
Intraday Short-Term (15-Minute): Moving averages present a clear bearish alignment. A breakdown below the 20-period moving average at $4,062.00 during early trading offered a short entry, with stop-loss referenced at $4,074.00 and an exit targeted at a 2:1 risk-reward ratio.
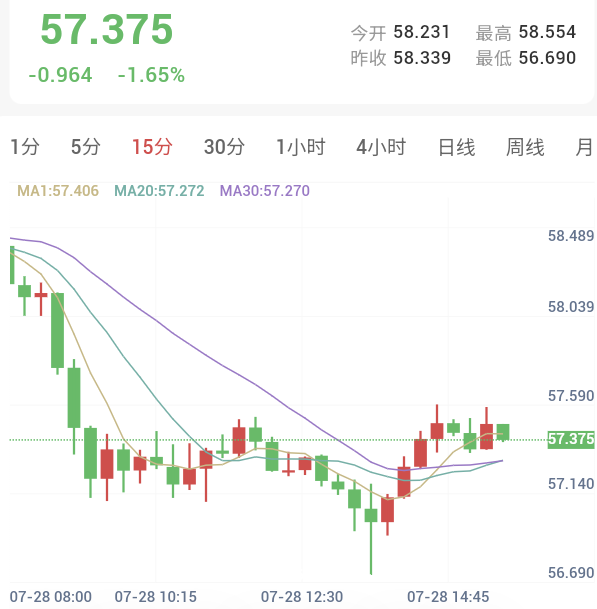
Silver Technical Analysis
Daily Chart: Silver opened at $58.231 per ounce today, trading lower under strong selling pressure to reach a low of $56.690 per ounce. Moving averages remain in a bearish death cross posture. Short positions established upon breaking below the 20-period moving average two sessions ago can be held, with stop-loss maintained at $60.911.
Intraday Short-Term (15-Minute): Moving averages exhibit a bearish alignment. A move below the 20-period moving average to new lows at $57.738 signals a short entry, with stop-loss set above the breakout candle high at $58.12 and an exit targeted at a 2:1 risk-reward ratio.
Risk Warning
Financial market trading involves unpredictable risks, including but not limited to the loss of principal. This analysis is for reference only and does not constitute direct investment advice. Investors should make independent judgments and autonomous decisions based on their own risk tolerance.