

Market Fundamentals Analysis
I. US June Core PCE Inflation Cools Beyond Expectations as Q2 GDP Growth Slows
Data released on the evening of July 30 showed that the US June PCE Price Index fell 0.1% month-on-month, marking its first monthly negative growth since 2020, with the year-on-year increase narrowing from 4.1% to 3.7%. Core PCE rose by only 0.1% month-on-month, below the market expectation of 0.2%, with the year-on-year rate cooling to 3.3%. Meanwhile, US second-quarter GDP grew at an annualized rate of 1.5%, significantly lower than market expectations and previous figures. Sustained inflation cooling combined with slowing economic growth led market expectations for a Federal Reserve rate hike in September to pull back noticeably.
II. US-Iran Diplomatic Engagement Advances as Saudi Arabia Leads Red Sea Security Alliance
On July 31, the Pakistani Foreign Ministry confirmed that the US and Iran were conducting negotiations regarding the restoration of stability in the Strait of Hormuz, with shipping traffic through the strait showing a clear recovery. Concurrently, Saudi Arabia spearheaded a multi-nation initiative to form a maritime security alliance across the Red Sea and Gulf of Aden, leading to a marginal easing of regional maritime risk. Driven by subduing geopolitical tensions, international energy benchmark prices pulled back near key levels, gradually dissipating accumulated energy-driven inflation premiums and lessening market anxiety over higher-for-longer Fed interest rates, providing macroeconomic support for gold and silver rebounds.
III. Market Sentiment Recovers Following Resolution of Hawkish Fed Split
After the July Federal Reserve meeting maintained interest rates unchanged alongside a hawkish dissension of three dissenting votes for a rate hike, the market gradually digested policy uncertainty. The US Dollar Index lost the 101 threshold, relieving valuation pressures on precious metals. Coupled with technical oversold bounce requirements following deep pullbacks in gold and silver, dip-buying capital and short-covering inflows entered the market simultaneously. This pushed gold and silver into a two-session rally, with silver outperforming gold due to its industrial properties and smaller market size.
IV. Global Central Bank Gold Purchases Surge 62% Year-on-Year in Q2
The World Gold Council's Q2 Gold Demand Trends report revealed that global central banks and official institutions added a net 289 tonnes of gold in the second quarter, representing a sharp 62% year-on-year increase, with total first-half global gold demand rising 2% year-on-year. Surveys indicate that nearly half of surveyed central banks plan to continue increasing gold reserves over the coming year. Strategic allocation demand driven by de-dollarization provides structural downside support, which, alongside recovering market sentiment, further solidifies fundamental backing for gold and silver and limits downside pullback potential.
Gold Technical Analysis
Daily Chart Level:
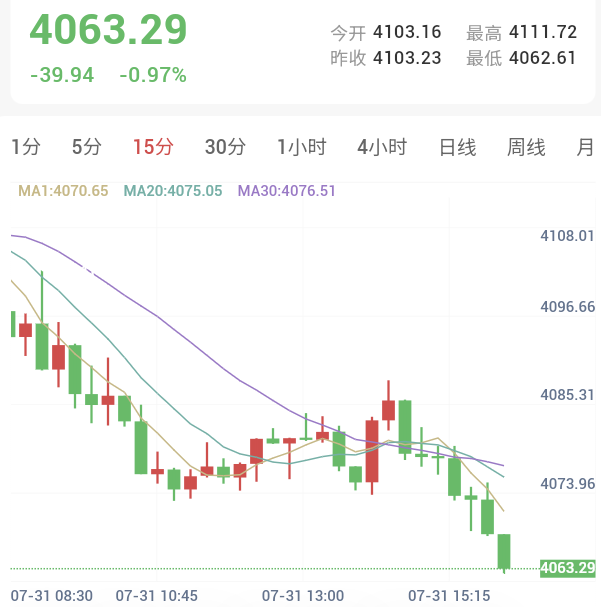
Spot gold opened at $4,103.16 per ounce during today's Asian session, edging lower under selling pressure. Moving averages remain in a death cross configuration. Short positions opened around $4,049.00 may be held, with stop-loss maintained at the previous high around $4,166.00.
Intraday Short-Term (15-Minute):
Moving averages display a bearish alignment, with prices oscillating between the 20 and 80 moving averages. Wait for prices to break back below the 20-period moving average before entering short positions, targeting a 2:1 reward-to-risk exit ratio.
Silver Technical Analysis
Daily Chart Level:
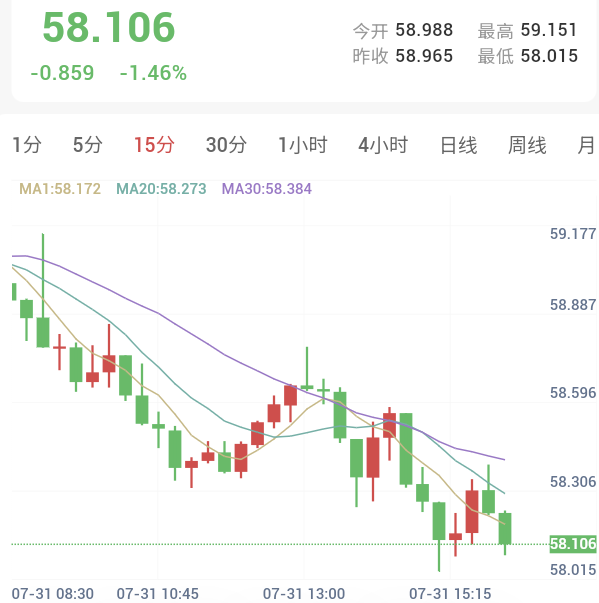
Spot silver opened at $58.988 per ounce today, trading lower in a bearish direction. Moving averages remain in a bearish death cross. Short positions established after breaking below the 20-day moving average two days ago may be held, with stop-loss maintained at $60.911.
Intraday Short-Term (15-Minute):
Moving averages display a bearish alignment, with prices trading beneath the 80 moving average. Wait for a pullback to the 20-period moving average followed by a breakdown signal before taking short positions.
Risk Warning
Trading markets carry inherent and unpredictable risks, including but not limited to the loss of principal. This analysis is provided for reference only and does not constitute direct investment advice. Investors should make independent judgments and autonomous decisions based on their risk tolerance.