

I. Fundamentals
US-Iran Diplomatic Concessions:
Reports indicate Iran and Oman are finalizing a conflict framework. Granting Tehran regulatory authority over the Strait of Hormuz marks a key US concession.
Fed September rate hike odds dropped to 54.9%, boosting precious metals momentum.
ADP Employment Plunges to 44,000:
US ADP payrolls added just 44,000 jobs in July, missing expectations with June revised lower.
Slowing labor momentum pressured 10-year Treasury yields and the US dollar, fueling gold rallies.
Fed's Cook Maintains Hawkish Stance:
Fed Governor Cook noted willingness to raise rates if inflation remains elevated.
Market focus shifts to Thursday jobless claims and Friday Non-Farm Payrolls.
II. Technical Analysis
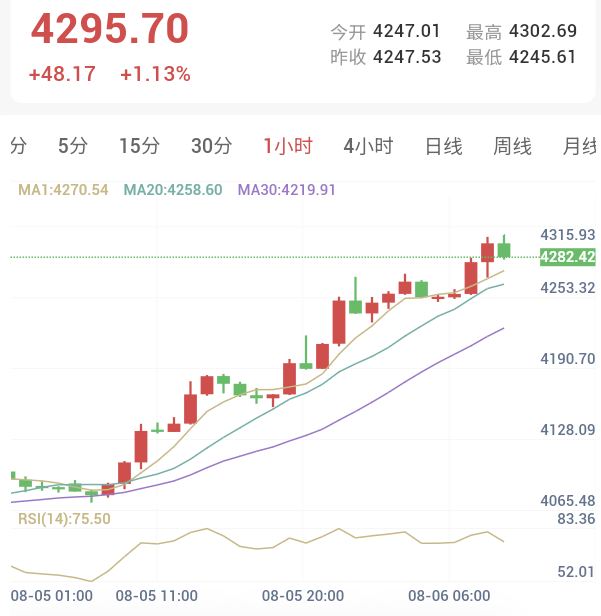
1-Hour Chart (Short-Term: Strong Bullish / Overbought)
Trend: Price trades firmly above MA1 (4270.54 USD), MA20 (4258.60 USD), and MA30 (4219.91 USD) in steep bullish alignment.
Indicators: RSI at 75.50 confirms strong bullish control alongside short-term overbought conditions.
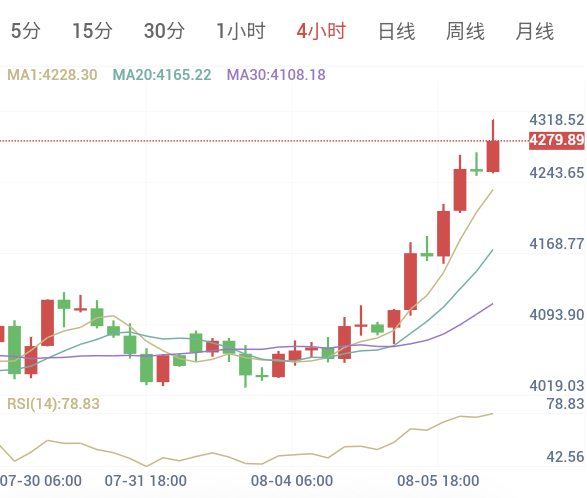
4-Hour Chart (Medium-Term: Bullish / Severely Overbought)
Trend: Strong breakout momentum with upward support bands. Piercing upper Bollinger bands warrants caution against profit-taking pullbacks.
Indicators: RSI at 78.83 signals heavy overbought levels.
III. Execution Strategy
Given strong technical signals and slowing labor metrics, a buy-on-dips strategy is advised:
Direction: Buy on Dips
Signal: Buy
Confidence: 85/100
Entry Zone: 4190.00 - 4320.00
Entry Midline: 4255.00
Stop-Loss: 4150.00
Take-Profit Zone: 4465.00
Risk/Reward Ratio: 1:2.00
Execution Details:
Gold trades near 4280.00 - 4295.00 USD with RSI near 75-80. Avoid chasing highs. Wait for technical retracements toward 4255.00 or support near 4190.00 - 4220.00 before scaling into long positions.
Risk Warning
Trading involves substantial risk of loss. This analysis is for reference only and does not constitute investment advice.