

I. Fundamental Analysis
Gold Pulls Back After Touching 4435 Peak as Markets Await CPI:
On Tuesday, gold surged to 4434.84 USD/oz, marking a new high since June 5, before pulling back due to short-term profit-taking and rising Treasury yields. Moving into Wednesday's Asian session, gold prices stabilized near 4380 USD. Market focus has shifted entirely to tonight's US inflation figures.
Tonight at 20:30 US CPI Serves as Critical Directional Catalyst:
US July CPI will be released tonight at 20:30 Beijing Time. Markets expect headline CPI to rise 0.1% MoM and slow to 3.4% YoY from 3.5%; core CPI is expected to rise 0.2% MoM and drop to 2.5% YoY. Markets currently price in a 48% probability of a 25 bps rate hike in September, making tonight's print vital for gold's immediate trajectory.
Middle East Shipping Conditions Tense Up Further:
US military officials stated Tuesday that an MH-60 helicopter fired two missiles at the Panama-flagged cargo vessel Vela Nova attempting to break the blockade on Iranian ports, disabling its propulsion; on the same day, a vessel in the Bab-el-Mandeb Strait was attacked, killing 4 crew members and 2 rescuers. Only 6 ships transited the Strait of Hormuz on Monday, far below pre-conflict levels, providing underlying support to gold prices.
II. Cyclical Technical Analysis
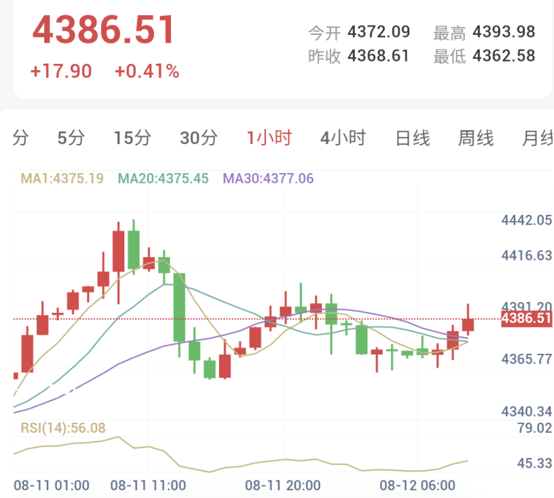
1-Hour Chart (Intraday Short-Term: Neutral-Bullish / Bounce Repair)
Trend Assessment:
The 1-hour chart displays a rapid pullback following a peak near 4435, with price currently trading near 4386.51. MA1 prints 4375.19, MA20 prints 4375.45, and MA30 prints 4377.06, clustering tightly together and signaling a transition from a unilateral rally to high-level consolidation.
Price has reclaimed the moving average cluster, rebounding from intraday lows at 4362.58, though immediate resistance remains near 4393.98.
Indicator Monitoring:
RSI(14) records 56.08, cooling significantly from overbought levels into a neutral-bullish zone.
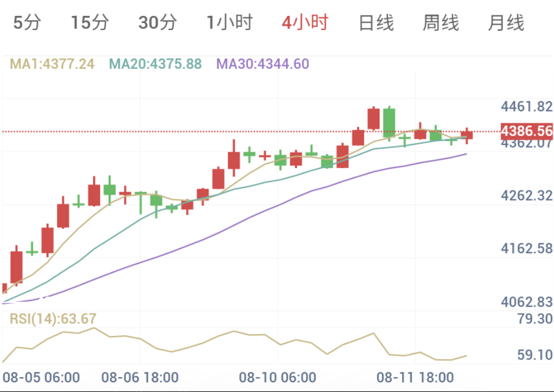
4-Hour Chart (Medium-Term Trend: Bullish Dominance / High-Level Consolidation)
Trend Assessment:
The 4-hour market structure remains firmly bullish. Price trades comfortably above MA1 at 4377.24, MA20 at 4375.88, and MA30 at 4344.60, with medium-term moving average alignments intact.
Following the pullback from 4435, price entered consolidation. As long as the 4362 to 4375 support zone holds firm, the 4-hour framework reflects a technical consolidation following a major rally.
Indicator Monitoring:
RSI(14) records 63.67, remaining in bullish territory while momentum moderates relative to prior moves.
III. Trade Execution Plan
With 4-hour trends remaining bullish and 1-hour charts completing overbought repairs, today's strategy prioritizes buying on pullbacks while selectively monitoring short options at resistance.
Strategy Direction: Buy on Pullbacks
Entry Reference Zone: 4372.00 - 4378.00
Key Support: 4362.58 - 4365.77
Stop Loss Reference: Structural failure below 4362.58
First Target: 4393.98
Second Target: 4430.00 - 4435.00
Trade Confirmation: 15-minute or 1-hour candles showing long lower wicks, bullish engulfing patterns, or fakeouts re-claiming 4375.
【Execution Details】
If price pulls back into the 4372 to 4378 moving average cluster and stabilizes, look for trend-following long opportunities; if price dips toward 4362 and rapidly recovers, monitor for stabilization rebounds.
If the 1-hour chart breaks below 4362.58 convincingly, short-term bullish momentum weakens, and long entries should be paused.
Risk Disclaimer
Trading markets carry inherent risks, including the loss of principal. This analysis is provided for reference only and does not constitute direct financial advice. Investors should evaluate risk tolerance and make independent investment decisions.