

I. Fundamentals & Geopolitical Drivers
Spot gold broke through $4,600 to print a high of $4,632.90/oz, driven by US national debt crossing $40 trillion alongside expanded Treasury bond buybacks. Growing fiscal credibility concerns accelerated dollar sell-offs toward hard assets like gold and silver. Simultaneously, impending US secondary sanctions on Iranian energy and Middle Eastern retaliatory threats heighten supply disruption risks.
II. Technical Structure
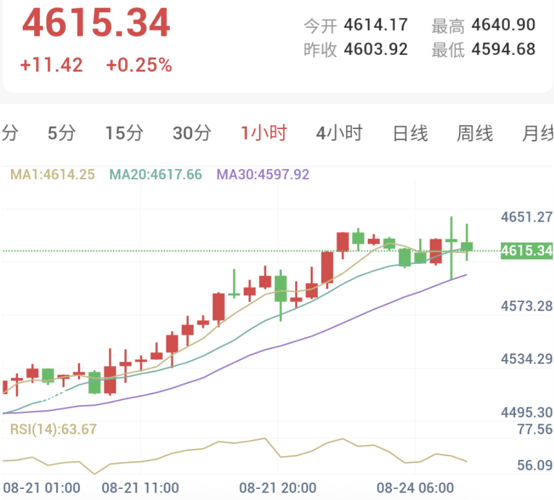
H1 Chart: Spot gold consolidates near $4,610.20 above MA30 support, converting the $4,600 psychological level into primary support. RSI holds at 61.22.
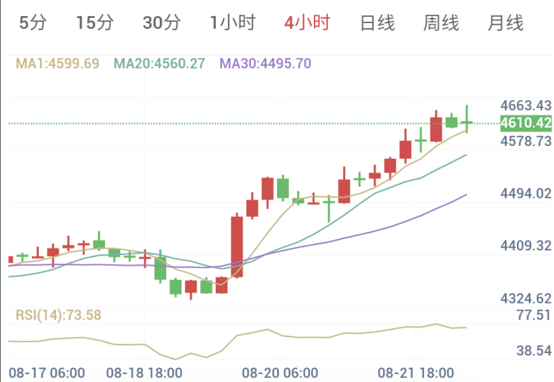
H4 Chart: Strong bullish structure intact. Prices trade above MA1, MA20 ($4,560.27), and MA30 ($4,495.70) with ascending moving averages. RSI stands at 73.58.
III. Execution Plan
Direction: Buy on Dips (Bullish Trend Alignment)
Confidence Index: 85 / 100
Entry Range: $4,595.00 - $4,750.00 (Midpoint: $4,672.50; Current Ref: ~$4,610.00)
Stop-Loss: $4,528.87
Take-Profit Target: $4,959.77
Risk-Reward Ratio: 1 : 2.00
Execution Detail: Initiate light long positions around $4,610.00. Add to long exposure if price retraces to $4,595.00 - $4,600.00 and confirms support.
Conclusion
US debt expansion and geopolitical tensions provide strong tailwinds for gold above $4,600. Traders should monitor $4,600 support holding ahead of central bank commentary.