

I. News Event: Trump Counters Iran Demands with Counter-Compensation Claims
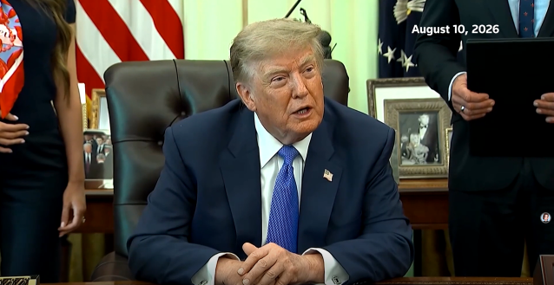
Global diplomatic optimism faltered on Monday after US President Donald Trump issued a stern response to Iran's peace conditions, demanding substantial monetary damages from Tehran for past actions over the last 50 years.
The United States explicitly rejected Iran's precondition regarding transit fees and access restrictions along the Strait of Hormuz.
Trump's unexpected demand extends beyond the temporary June agreement framework, creating high uncertainty for ongoing diplomatic negotiations. As hopes for a quick opening of the shipping lane dimmed, energy spot prices surged 5%, reviving cost-push inflation anxieties.
II. 30-Minute Chart: Hits 4435.29 USD Peak Before Undergoing Sharp Selloff
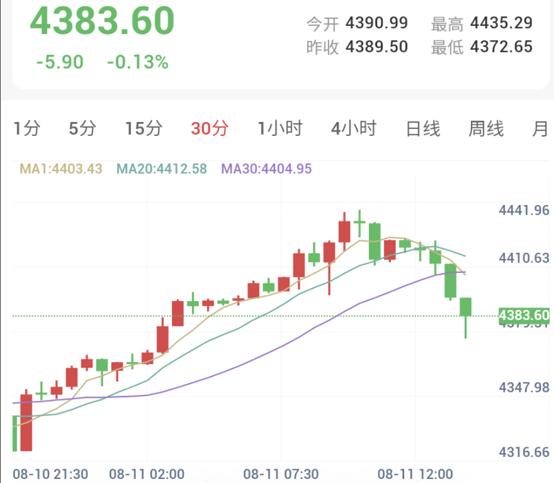
As of 13:45 Beijing Time, spot gold traded at 4383.60 USD/oz, down 5.90 USD (-0.13%).
The 30-minute chart depicts an intraday surge followed by a sharp pullback. Gold opened at 4390.99 USD/oz and rallied to a fresh peak at 4435.29 USD/oz before heavy selling pushed prices down through key moving averages to an intraday low of 4372.65 USD/oz.
III. 30-Minute Technical Indicators: Short-Term Outlook Shifts to Strong Sell
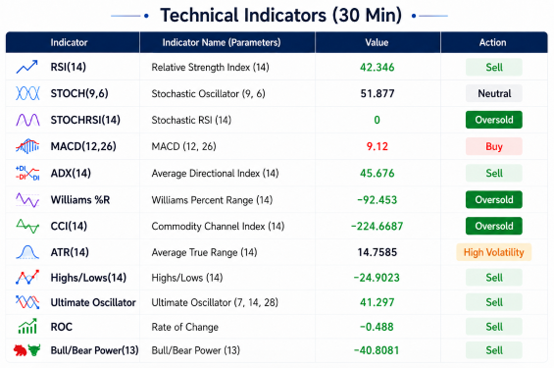
Technical indicators evaluate to a Strong Sell stance (1 bullish, 1 neutral, 6 bearish), as trend metrics turned bearish while short-term oscillators hit deeply oversold zones:
Bearish Trend and Momentum Alignment:
RSI(14) records 42.35, hovering in bearish territory.
ADX(14) records 45.68, confirming persistent downside momentum.
Highs/Lows records -24.90.
Bull/Bear Power records -40.81.
ROC records -0.49.
Ultimate Oscillator records 41.30.
MACD(12,26) records 9.12, reflecting residual bullish momentum.
STOCH(9,6) records 51.88, remaining strictly neutral.
Deeply Oversold Oscillators:
StochRSI(14) prints 0.00.
Williams %R prints -92.45.
CCI(14) prints -224.67, with all three hitting deeply oversold extremes.
Technical Summary:
Indicator readings signal that initial profit-taking concentrated heavily after touching 4435.29 USD. Deeply oversold oscillators suggest the initial selling impulse is nearing exhaustion, favoring technical consolidation above 4370 USD.
IV. Conclusion
Trump's compensation demand dampens quick diplomatic resolution expectations in the Middle East, while a 5% surge in energy prices reinforces higher-for-longer rate assumptions, capping gold's immediate upside. The 30-minute chart highlights a pullback from 4435.29 USD below moving averages, though extreme oversold conditions hint at potential short-term stabilization.