

I. News Event: US Threatens Indefinite Blockade

Geopolitical standoffs deepened in the Middle East on Thursday as hardline US statements shattered hopes for a short-term peace agreement. The US Defense Secretary explicitly confirmed that US forces possess the capability to maintain an "indefinite" maritime blockade against Iran via continuous ship rotations.
Concurrently, the US Treasury Secretary announced unprecedented financial isolation measures scheduled for next week, signaling that diplomatic negotiation has fully yielded to maximum pressure.
In physical supply chain channels, tensions are accelerating disruptions across energy markets. The International Energy Agency (IEA) downgraded global energy supply forecasts on Wednesday, projecting a daily output contraction of 4.3 million barrels (-4%) this year.
Furthermore, regional skirmishes escalated as UAE authorities reported Iranian attacks on two state-owned merchant vessels transiting the Strait of Hormuz, while Yemen's Houthis launched drone strikes against Saudi refining infrastructure.
II. 30-Minute Chart: Unilateral Breakdown Under Steep Moving Average Suppression
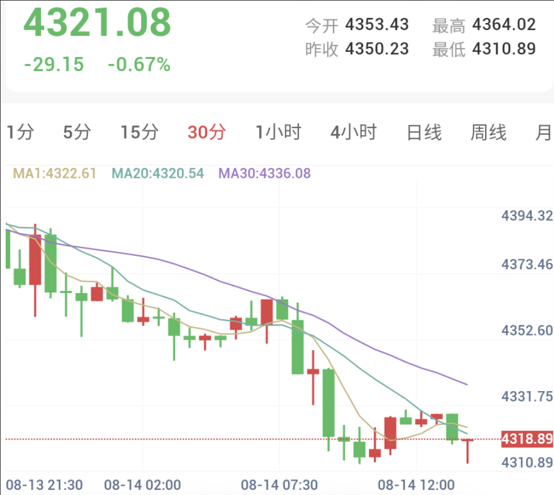
Spot gold displayed a smooth unilateral breakdown on the 30-minute chart today. Opening at $4,353.43 per ounce, gold attempted minor resistance above $4,350 to reach an intraday high of $4,364.02 before collapsing under stop-loss selling pressure as blockade headlines mounted.
Currently, MA20 ($4,320.54) and MA30 ($4,336.08) exhibit a steep bearish downward divergence, keeping price action strictly pinned below MA30. All intraday bounce attempts remain firmly capped by moving average resistance.
III. Technical Indicators: Bears Dominant as Sensitive Metrics Touch Oversold
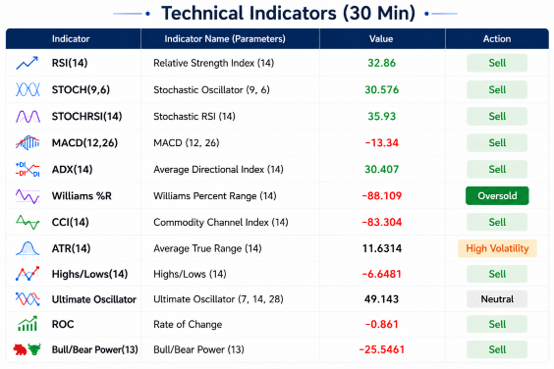
Technical indicators on the 30-minute timeframe register an extreme "Strong Sell" assessment (0 Buy, 1 Neutral, 9 Sell):
Trend and Momentum Indicators (All Bearish):
MACD (12,26) at -13.34 with widening negative histogram bars.
ADX (14) at 30.41 confirming steady downward trend strength.
Bull/Bear Power at -25.55.
ROC at -0.86.
Core Oscillators (Weak Zone):
RSI (14) at 32.86 approaching the 30 oversold threshold.
STOCH (9,6) at 30.58.
Sensitive Metrics (Oversold Territory):
Williams %R at -88.11 in extreme oversold territory.
StochRSI (14) at 35.93.
CCI (14) at -83.30.
While hawkish rate expectations heavily weigh on gold's broader structure, extreme oversold readings on Williams %R suggest panic selling has partially spent its momentum, opening room for technical consolidation near MA20.
IV. Conclusion
Uncertainties surrounding an indefinite blockade alongside IEA supply deficit warnings have reinforced hawkish central bank expectations, applying heavy macro pressure on gold. On the 30-minute chart, gold remains locked in a unilateral decline below steep moving averages. Immediate focus centers on whether $4,310 holds as localized support and how prices react to MA30 ($4,336) overhead resistance.