

Trump Calls Russia-Ukraine War True Driver of Inflation: Gold Breaks Down Toward $4,300 Mark
1. News & Geopolitical Events: Trump Urges End to Strikes on Russian Fuel Facilities
On Sunday, Donald Trump stated in Ireland that current global energy shortages are not primarily driven by Middle Eastern conflict, asserting instead that the Russia-Ukraine war serves as the primary catalyst behind energy inflation.
He publicly appealed to Ukrainian President Volodymyr Zelenskyy to halt strikes against Russian fuel refineries and infrastructure, stating that such operations have aggravated international fuel deficits and are "hurting the world."
In recent months, Ukrainian long-range drone strikes have targeted Russian refining capacity, disrupting domestic fuel output and precipitating broad regional supply constraints.
Nationwide, average US wholesale diesel fuel prices (critical for freight trucks, rail, maritime, and agricultural machinery) crossed the historic $6 per gallon milestone on Thursday.
2. 30-Minute Candlestick Chart Analysis: Heavy Volume Breakdown Slices Through Support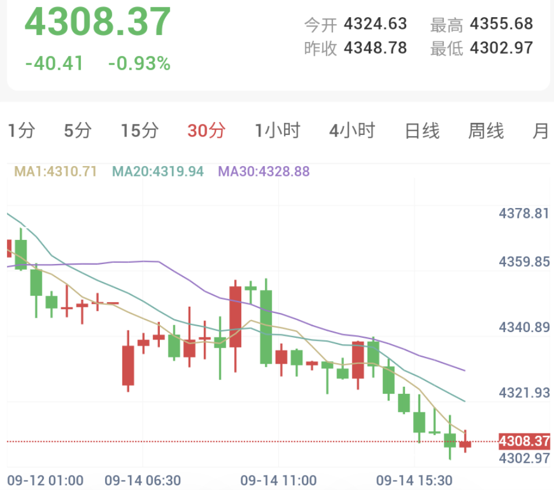
As of 17:15 Beijing time, spot gold traded at $4,308.37/oz, dropping 0.93% (-$40.41) intraday to press directly against the critical $4,300 psychological support zone.
Gold previously attempted to consolidate near 4,350, reaching an intraday peak of 4,355.68. However, intense overhead selling triggered an abrupt structural breakdown. Price action plunged via consecutive bearish candles along a steep downward trajectory, recording an intraday low of 4,302.97.
Across moving averages, the precipitous decline has forced short-term moving averages into a steep, downward-fanning bearish alignment, with all primary moving averages positioned well above price action.
3. 30-Minute Technical Indicators: Trend Metrics Signal Strong Sell as Oscillators Enter Deep Oversold Territory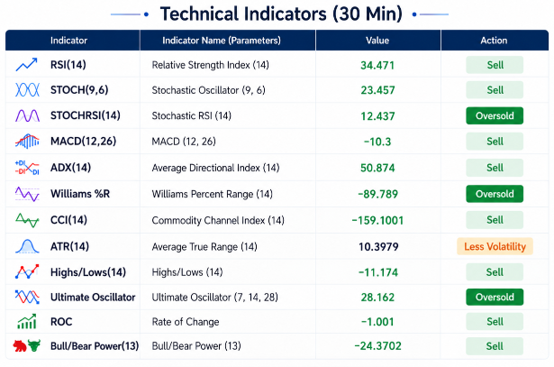
Following an intraday slide exceeding $40, the 30-minute technical indicator composite registered an unequivocal "Strong Sell" rating (0 buy, 0 neutral, 8 sell), with bears exerting absolute control while sensitive oscillators entered deep oversold territory:
• Core Trend and Momentum Indicators Remain Strongly Bearish: The ADX(14) trend strength indicator printed at 50.87 with a sell signal, confirming exceptional directional momentum. The MACD(12,26) plunged deeper to -10.30, issuing persistent sell signals. The RSI(14) stood at 34.47, held firmly in bear territory.
• Sensitive Oscillators Flash Widespread Oversold Conditions: The fast StochRSI(14) registered at 12.43, the Williams %R plunged to -89.78, and the Ultimate Oscillator dropped to 28.16. All three sensitive momentum metrics reside in deep oversold bands.
This technical confluence suggests that following the test of 4,302.97, aggressive selling pressure has reached near-term exhaustion, creating technical room for a stabilization phase or a corrective mean-reversion bounce toward overhead moving averages before any further breakdown.
4. Summary
Sustained Ukrainian strikes against Russian refining complexes, coupled with prolonged Middle Eastern maritime friction, have placed immense strain on global energy distribution. Unchecked fuel inflation stokes broad structural price pressures, reinforcing the Federal Reserve's commitment to maintain restrictive policy settings. Within this macroeconomic environment, non-yielding gold remains vulnerable, with immediate attention focused on whether the $4,300 benchmark can hold.