

I. Fundamental Analysis
Non-Farm Payrolls Data Cools Sharply:
The US Department of Labor released the June non-farm payrolls report showing that the US added only 57,000 jobs, falling far short of the market expectation of 110,000.
Concurrently, data for April and May were revised down by a combined 74,000 jobs. Although the unemployment rate pulled back to 4.2%, the main driver was that 720,000 individuals left the workforce.
This caused the labor force participation rate to plunge to 61.50%, its lowest level since March 2021. Sector data highlights a severe contraction in leisure and hospitality, with a total of 61,000 jobs vanishing, including a plunge of 33,000 positions in restaurants and bars and 22,000 layoffs in the hotel industry.
Rate Hike Expectations Plummet:
The weak employment report instantly flipped the interest rate futures market upside down. The CME FedWatch Tool shows that the priced probability of a September Fed rate hike has dropped to 53.2%. Full-year rate hike expectations shrank from 42 basis points down to 28 basis points, and market pricing included the possibility of no rate hikes at all in 2026 for the first time.
Following the NFP release, the US Dollar Index plunged in a straight line and Treasury yields crashed. Driven by the collapse in tightening expectations, spot gold skyrocketed 2.20% to hit $4,190.59 per ounce, completely erasing its losses from earlier in the week.
II. Current Trend and Multi-Timeframe Structural Analysis
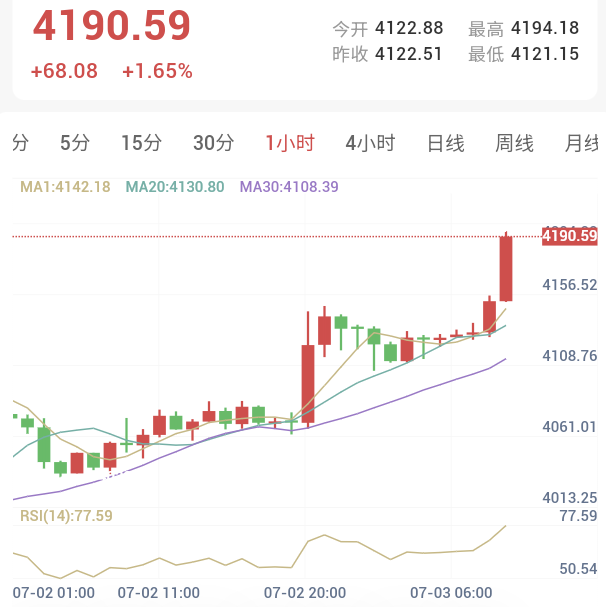
1-Hour Chart (Intraday Short-Term: Bullish but Overheated)
- Market Assessment: The short-term chart exhibits a powerful upward breakout on expanding volume, with successive large bullish candlesticks reclaiming lost ground and rallying into the $4,188.00–$4,194.00 range. However, the current price has significantly deviated from the short-term moving average systems below. Multiple technical indicators suggest that the rally has been too rapid, and the market faces an intraday risk of a technical pullback for indicator correction.
- Indicator Monitoring: The RSI printed at 77.59, indicating extreme short-term market volatility.
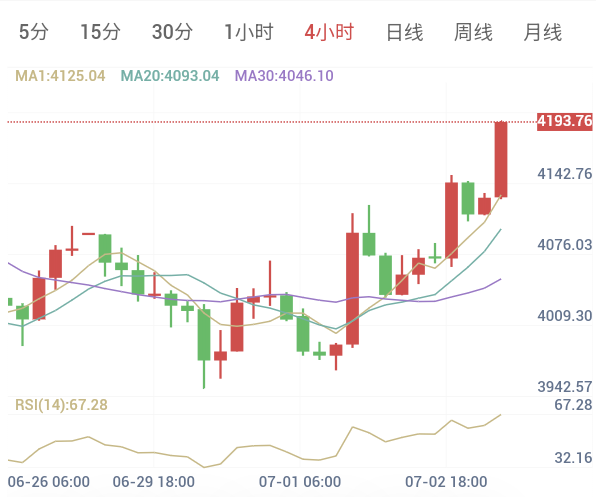
4-Hour Chart (Medium-Term Trend: Bullish Breakout)
- Market Assessment: The medium-term technical chart shows a powerful upward breakout driven by large bullish candlesticks. Prices have successfully stabilized above all major moving average systems, and the short-to-medium-term structure has clearly turned strong. However, with the 4-hour RSI climbing near 66.85, the risk of a pump-and-dump intraday will rise simultaneously if the market continues to extend blindly.
- Indicator Monitoring: The RSI printed at 67.28, drawing close to the overbought zone.
III. Support and Resistance Analysis
- Core Resistance Level: 4,240.00 (The medium-term overhead resistance line if bullish strength extends).
- Core Support Level: 4,120.00–4,125.00 (Near today's intraday low of 4,121.15 and the 4-hour MA1 moving average).
IV. Trading Execution Plan
The dominant direction for gold is consistently bullish due to the favorable NFP data catalyst. However, since the short-term trend has entered a high-level acceleration phase and multiple technical indicators are severely overbought, the current position is not suitable for blindly chasing highs. The intraday recommendation focuses on buying dips upon a pullback or buying breakouts on right-side confirmation:
Scenario 1: Bullish Pullback Plan (Aggressive or Conservative)
- Entry Observation Range: 4,175.00–4,180.00 or 4,156.00–4,160.00 (For a deeper pullback, focus on 4,138.00–4,142.00).
- Entry Confirmation Signal: Price stabilizes on a pullback to support on the 15-minute or 1-hour chart, printing long lower wicks, a minor bullish engulfing/counterattack pattern, or reclaiming short-term support.
- Stop-Loss Reference: Set below 4,168.00, 4,148.00, or 4,120.00, depending on the specific entry point.
- Take-Profit Target Range: First target: 4,194.00–4,200.00; Second target: 4,210.00–4,220.00; Third target: Around 4,240.00.
- Invalidation Condition: The price breaks below the key support at 4,156.00 and fails to reclaim 4,160.00 on a retest.
Scenario 2: Bullish Breakout Plan
- Entry Observation Range: After effectively breaking above the 4,200.00 mark, wait for a pullback to 4,194.00–4,200.00.
- Entry Confirmation Signal: The 1-hour close confirms a firm hold above 4,200.00, the retest holds, and bullish momentum resumes with expanding green candles.
- Stop-Loss Reference: Below 4,180.00.
- Take-Profit Target Range: First target: 4,210.00–4,220.00; Second target: Around 4,240.00.
- Invalidation Condition: Price falls back below 4,180.00.
The current price sits in an overheated risk zone following the rally, making the risk-to-reward ratio for chasing longs highly unfavorable. Since bearish momentum has not been established either, opening positions arbitrarily is discouraged. Maintain patience and wait for the price to approach core support or resistance levels before evaluating entries.
V. Subsequent Key Observation Checklist
- Whether the intraday price can effectively break out and stabilize above the 4,200.00 mark.
- Whether effective buying support emerges in the $4,175.00–$4,180.00 and $4,156.00–$4,160.00 regions during a pullback.
- Whether tests of the $4,194.00–$4,200.00 resistance zone are accompanied by signs of stagnation, such as long upper shadows or bearish engulfing patterns.
- Whether the 1-hour RSI continues to stretch and flatten in the overbought zone, or begins to turn down noticeably.
- Whether the 4-hour price and moving average systems will undergo a secondary confirmation and correction.
Risk Warning
Trading markets carry unpredictable risks, including but not limited to the loss of principal. This analysis is for reference only and does not constitute direct investment advice. Investors should make independent judgments and autonomous decisions based on their own risk tolerance.