

Market Overview: Step-Down Decline Shifts Into Low-Level Range Play
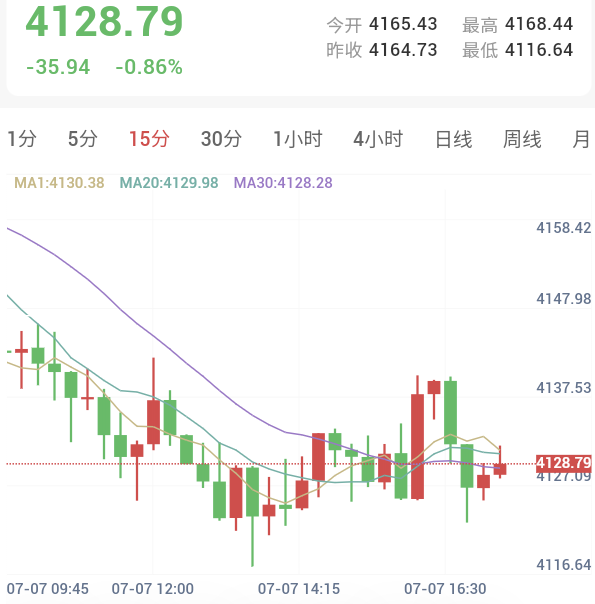
- Chart Characteristics: Following a clear step-down retracement from near $4,170.00 down to the $4,116.00 zone, the 15-minute and 1-hour timeframes have simultaneously settled into a post-drop horizontal consolidation range. Because price action remains structurally capped underneath short-term moving averages and continues to print a sequence of lower highs and lower lows, the near-term setup maintains a distinctly bearish bias.
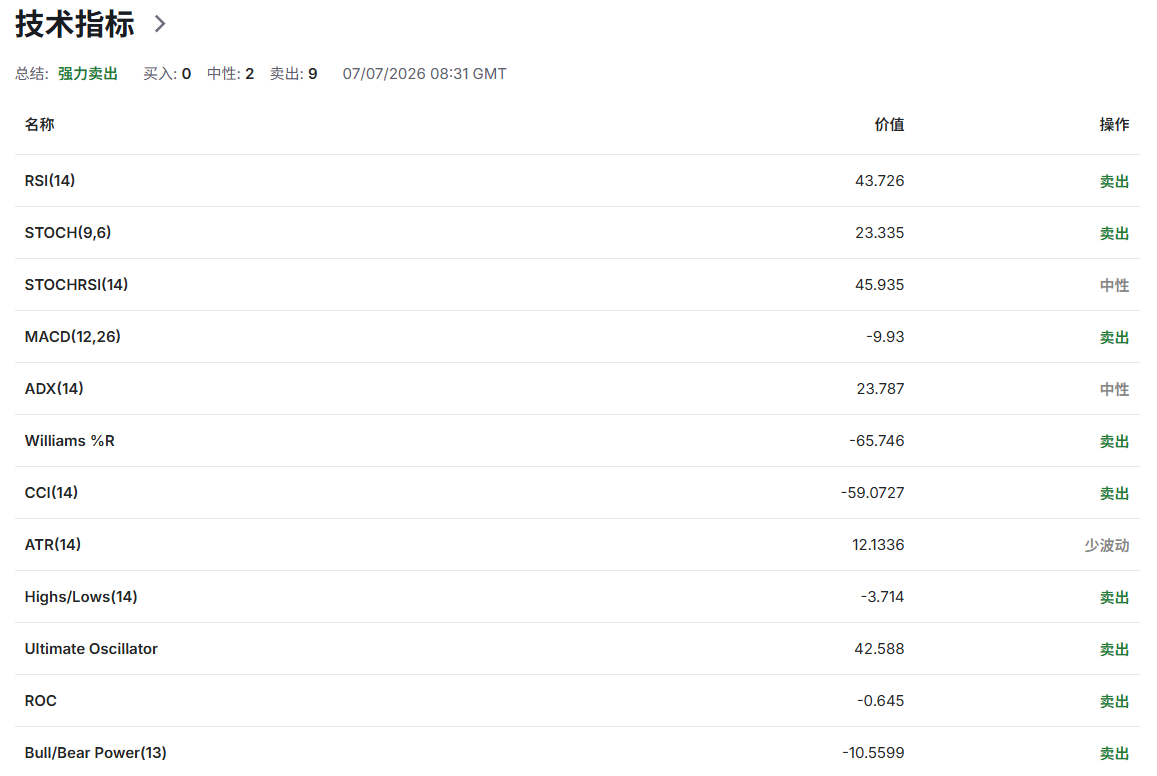
- Technical Indicators: While the 1-hour technical indicators flag a strong sell signal, the ATR (Average True Range) indicator shows that current market volatility is notably low. This implies that bears are not driving a panic-driven, one-sided acceleration, but are instead engaged in a grinding consolidation, trading time for technical chart space. The price is currently tracking near $4,126.00, pinned right within the lower section of the broader $4,116.00 – $4,138.00 consolidation box. Sitting this close to the intraday support floor means blindly chasing short positions here carries an incredibly high risk of getting caught in a sharp technical bounce.
Technical Outlook: Capped by Moving Average Cluster; Eyeing Breakout Confirmation
- Bearish Continuation Logic: As long as intraday relief rallies fail to decisively reclaim the core overhead resistance band between $4,132.00 and $4,138.00, the broader intraday structure remains locked under a weak, capped retracement profile.
- Looking ahead, a sustained break below $4,116.64—combined with a failure to reclaim the $4,120.00 handle on the retest—will officially invalidate the intraday support floor. Such a breakdown would unlock deeper downside expansion, exposing gold to a test of the $4,100.00 – $4,108.00 zone, followed by the major structural support cluster at $4,088.00 – $4,090.00.
Intraday Trading Strategy: Exercise Caution Near Mid-Range Axis; Position Near Key Boundaries
- Shorting on Rallies (Primary Bias): Avoid opening new positions near the mid-range axis around $4,126.00. Conservative market participants should patiently wait for a technical relief bounce to develop, keeping a close eye on the moving average cluster at $4,128.00 – $4,132.00 as well as the strong resistance zone layered at $4,138.00 – $4,143.00.
- Look for short entries once the bounce encounters overhead friction, ideally confirmed by candles printing long upper shadows or a clear bearish engulfing pattern.
- Risk Parameters & Targets: Place initial stop-losses above $4,143.00 or $4,153.00 depending on entry optimization. Downside profit targets are eyed near $4,120.00 – $4,116.00, expanding down toward the $4,100.00 – $4,108.00 structural band upon a clean breakout confirmation.
Risk Warning
The trading market carries unpredictable risks, including but not limited to the loss of principal. This analysis is for reference only and does not constitute direct investment advice. Investors should make independent judgments and autonomous decisions based on their own risk tolerance.