

Market Fundamentals Analysis
- US Revokes Iran Oil Sanctions Waivers and Launches Military Strikes: On July 7, the US Treasury Department announced the revocation of general licenses for Iranian oil sales. Simultaneously, the US military launched a series of airstrikes against military targets in southern Iran in response to recent attacks on commercial vessels in the Strait of Hormuz. Driven by these developments, international oil prices surged over 3% in a single day, lifting Brent crude back above $74.00 per barrel. The rebound in energy costs has reignited inflation anxieties, pushing the market-priced probability of a September Federal Reserve rate hike up to 67%. A strengthening US dollar paired with rising Treasury yields triggered concentrated liquidations in non-yielding precious metals.
- On the Eve of the Blockbuster June FOMC Minutes Release: On the evening of July 8, the Federal Reserve will release the full minutes of its June policy meeting. This marks the first complete record of a policy meeting chaired by the newly appointed Kevin Warsh, and macro desks will closely parse the text to evaluate the committee's inflation risk assessments and interest rate path debates. Interest rate futures are currently pricing a greater than 60% probability of a 25-basis-point rate hike in September, while rate cut expectations for the year have been completely wiped out. The higher-for-longer environment continues to elevate the opportunity cost of holding gold and silver. Investors are broadly scaling back exposure ahead of the release, keeping precious metals locked in a weak, cautious consolidation pattern.
- PBOC Ramps Up Gold Reserves for 20 Consecutive Months: Official data released on July 7 shows that China's central bank gold reserves reached 75.44 million ounces at the end of June 2026, marking an increase of 480,000 ounces from May. This single-month accumulation represents the largest addition since December 2023, extending the current buying cycle to 20 consecutive months. Concurrently, Hong Kong officially launched its Gold Central Clearing System and restarted USD-denominated gold futures trading, advancing its development as a regional precious metals hub. Under the secular macro trend of de-dollarization, long-term central bank accumulation continues to provide a structural cushion under gold and silver prices, ensuring low-level institutional bids limit extreme downside expansion.
- US June Consumer Inflation Expectations Hit Highest Since September 2023: The latest survey from the New York Fed revealed that US one-year inflation expectations rose to 3.7%, while three-year expectations climbed to 3.3%—both hitting near two-year highs, heavily driven by surging healthcare and rental costs. The re-acceleration of inflation expectations has reinforced market pricing that the Fed will sustain elevated interest rates for longer, further pushing back the timeline for eventual easing. Coupled with concentrated profit-taking following recent relief rallies, bullish momentum has evaporated. Prices face heavy overhead pressure, making a structural trend reversal unlikely in the near term.
Gold Technical Analysis
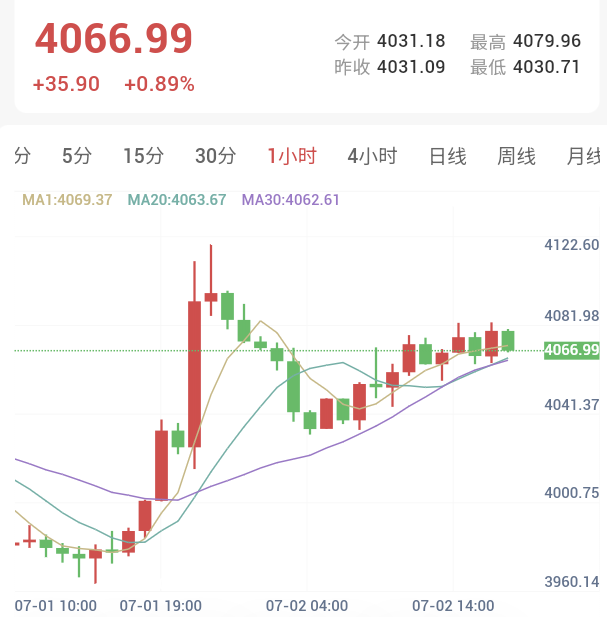
- Daily Chart: Gold opened the Asian session today at $4,097.46 per ounce. Triggered by the escalation in the US-Iran conflict, gold extended its sharp downward correction before staging a modest intraday relief bounce. Currently, the moving average system remains locked in a bearish dead cross alignment. Because yesterday's closing price cleanly broke below the 20-period moving average floor at $4,105.00, a structural setup to establish medium-term short positions has materialized. Initial stop-losses can be placed near the recent swing high around $4,203.00, targeting prior structural lows or executing on a strict 1:2 risk-to-reward ratio.
- Intraday Short-Term (15-Minute Chart): Moving averages are exhibiting a clear bearish alignment, with the price currently consolidating between short- and long-period moving average zones. Patiently wait for a clean breakdown past the moving average cluster to confirm entry timing.
Silver Technical Analysis
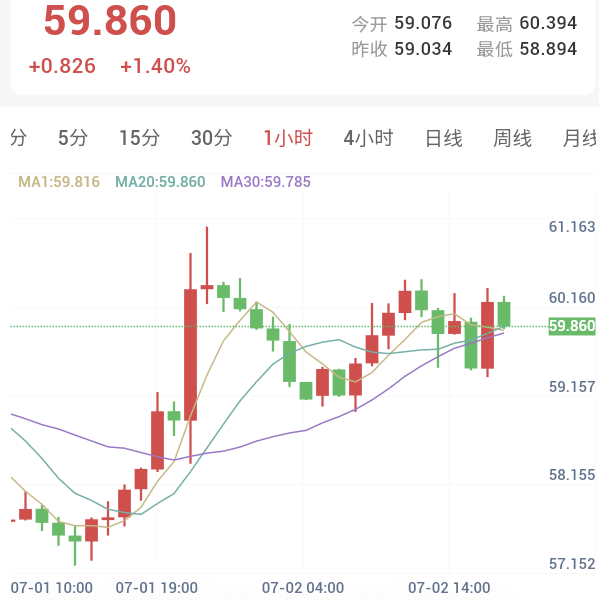
- Daily Chart: Silver opened the day at $59.945 per ounce, consolidating within a tight intraday range to mount a minor relief bounce. On the daily timeframe, the moving average system remains firmly in a dead cross structure, keeping the broader macro path heavily tilted to the downside. Patiently wait for a technical retest of the daily 20-period moving average before scouting fresh entries.
- Intraday Short-Term (15-Minute Chart): The short-term moving averages are in a bearish configuration, though the price is currently trading above the 80-period moving average. Prudence dictates waiting for the price and the moving average system to align directionally before initiating new positions.
Risk Warning
Trading markets carry unpredictable risks, including but not limited to the complete loss of principal. This analysis is compiled exclusively for structural reference and does not constitute direct financial or investment advice. Market participants must independently evaluate their individual risk tolerances and execute autonomous trading decisions.