

I. Fundamental Analysis
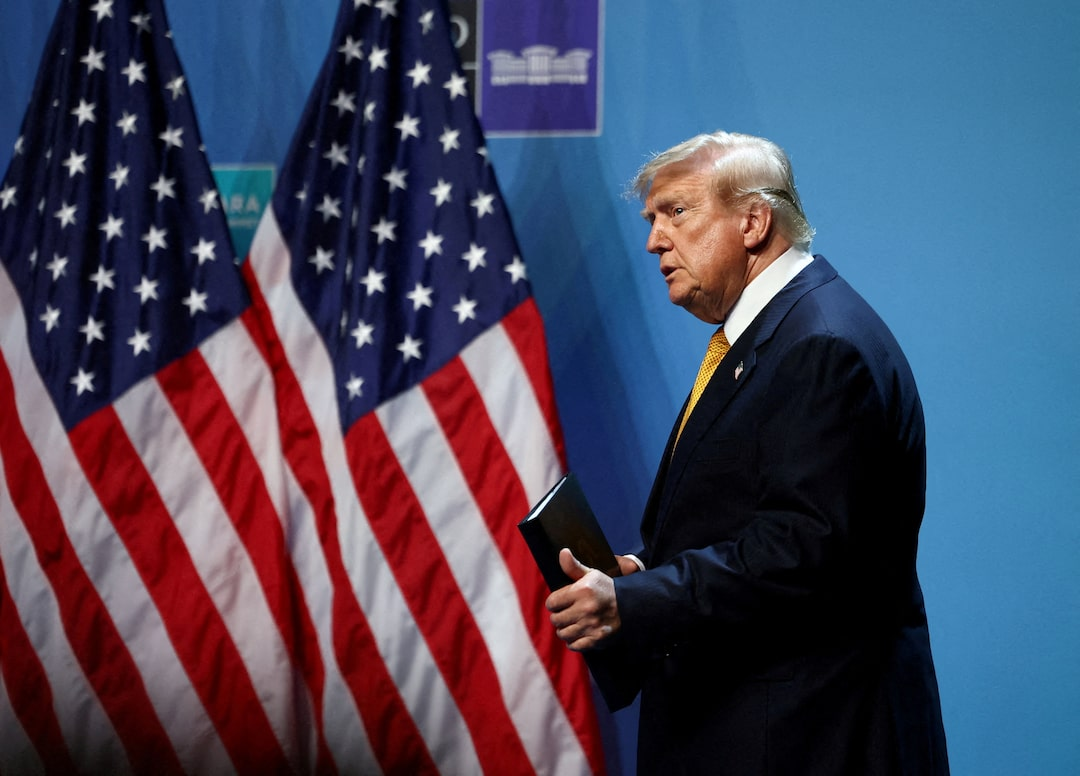
Conflict Enters Sixth Day, Warfare Faces Full-Scale Escalation: US-Iran military strikes have proceeded into their sixth consecutive day, rendering the ceasefire agreement completely void. President Trump is currently coordinating with his advisors on more aggressive escalation measures, including the direct deployment of troops to seize Iran's Kharg Island oil hub, bombing the deeply buried underground nuclear facility code-named "Pickaxe Mountain," and publicly threatening to strike Iran's power plants and bridges starting next week. The US Central Command has launched airstrikes against the southern coast of Iran for the sixth consecutive night, leaving multiple radar and port facilities engulfed in flames.

Red Sea Shipping Lane Critical: In the face of the steady pressure from the US military, Iran has begun opening a "second front." Sources reveal that Tehran has instructed the Yemeni Houthis to prepare for an immediate blockade of the Bab-el-Mandeb Strait in the Red Sea should the US strike Iranian power infrastructure. Since shipping through the Strait of Hormuz has already ground to a virtual halt, another closure along the Red Sea corridor would expose global energy transit to an unprecedented dual blockade, sparking a renewed crisis of skyrocketing international oil prices.

Fed Vice Chair Jefferson Unleashes Strongly Hawkish Signals: Federal Reserve Vice Chair Jefferson delivered a hawkish speech on Thursday, emphasizing that the confluence of Middle East tensions and tariff shocks substantially increases the risk of inflation becoming deeply entrenched and expectations spinning out of control. He stated explicitly that if inflation fails to cool rapidly, it may be appropriate to reconsider interest rate hikes. This commentary drove the 10-year US Treasury yield higher, pushing the US dollar index up by 0.2% in a single day.
Gold Breaks Below the $4,000 Milestone: Spot gold plummeted by over 2% once again on Thursday, concluding the session at $3,976.02 per ounce, printing a fresh low since July 1.
II. Cyclical Technical Analysis
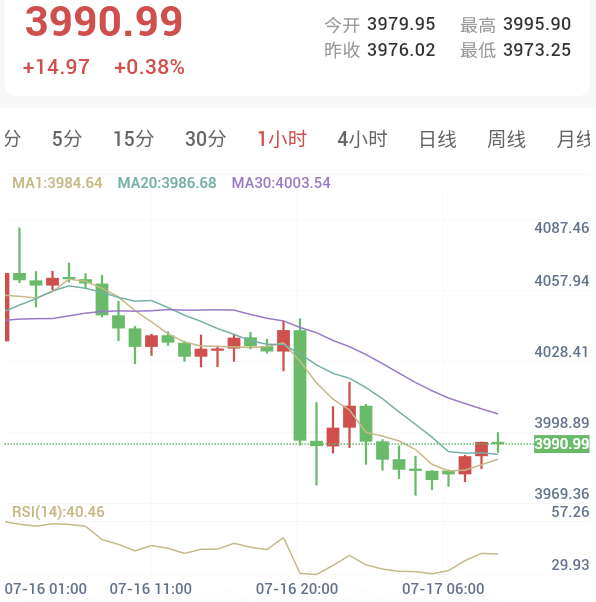
One-Hour Cycle (Intraday Short-Term: Sell)
Trend Assessment: The 1-hour chart displays a standardized and fluid single-way downward trend. Gold prices broke below the psychological threshold of $4,000.00 on high volume, directly smashing through the previous critical defensive lines of the bulls. Although the RSI indicator is currently hovering near overextended boundaries, which might invite technical weak corrections or sideways consolidation intraday, short-term market control remains strictly dominated by the bears as long as the price fails to reclaim core overhead resistance.
Indicator Monitoring: RSI reads 40.46, recovering from the weak zone, yet downward momentum remains robust.
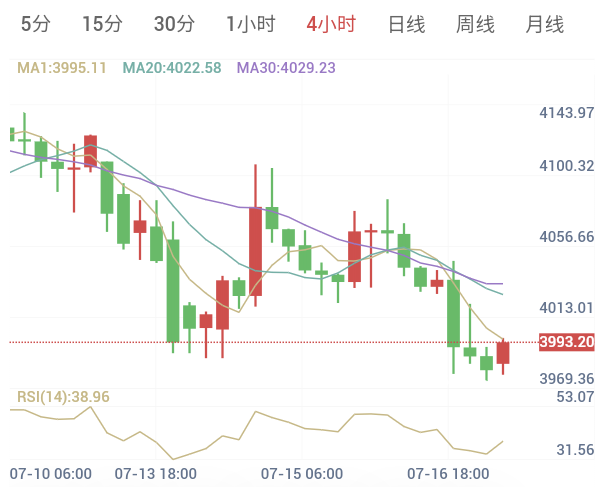
Four-Hour Cycle (Medium-Term Trend: Sell)
Trend Assessment: The 4-hour timeframe aligns in a powerful bearish resonance with the 1-hour chart. The moving average system is crossing downward at higher levels with lower highs and lower lows developing sequentially, marking a formal establishment of the medium-term downward channel.
Indicator Monitoring: RSI is recorded at 38.95, illustrating ample medium-term downward momentum.
III. Trading Execution Plan
Given that the 1-hour and 4-hour cycles exhibit a distinct bearish resonance, and macroeconomically gold is tracing a single-way weak path under the dual strain of high US Treasury yields and a strong US dollar where safe-haven properties have failed to trigger, a sell-on-rallies strategy will be adopted for intraday trading:
Strategy Direction: Sell on Rallies (Trend-Following Trade)
Trading Signal: Sell
Confidence Index: 85.00 / 100.00
Entry Range: 3980.00 - 4025.00
Range Midpoint: 4002.50
Stop Loss Protection: 4068.00
Take Profit Target: 3871.50
Risk-Reward Ratio: 1 : 2.00
【Execution Details】
Position Management and Rhythm: Given that the RSI indicators across both the 1-hour and 4-hour timeframes are hovering near oversold boundaries, blindly chasing shorts below $3,980.00 intraday runs the risk of being caught in short-term technical throwbacks. The most robust entry approach is to wait patiently for an intraday price retracement to test the range midpoint between $4,002.50 and $4,025.00, and progressively build short positions after the price confirms resistance with long upper shadows or bearish engulfing patterns.
Weekend Risks: Guard against the Friday weekend effect. Considering the rapidly shifting conditions of the current warfare, the tail end of the US session on Friday is highly susceptible to short-covering and position adjustments triggered by safe-haven flows or geopolitical uncertainties. Intraday operations should ideally be concluded before the US market close, or secured with protective stop-loss adjustments, to avoid carrying heavy exposure over the weekend.
Risk Warning
Trading in financial markets involves unpredictable risks, including but not limited to the loss of principal. This analysis is for reference only and does not constitute direct investment advice. Investors should make independent judgments and autonomous decisions based on their own risk tolerance.