

Market News Analysis
Middle East Conflict Spills Over to Red Sea Shipping Lanes: International benchmark energy prices surged over 7% in a single day, breaking above the critical $100 per barrel threshold to hit a two-and-a-half-month high. The violent crude oil rally significantly heightened expectations of sticky inflation, shifting market logic away from traditional safe-haven buying toward a hawkish chain reaction: "Surging energy prices leading to higher-for-longer Federal Reserve interest rates or even additional rate hikes." Rate hike bets completely overshadowed safe-haven bids.
US Weekly Initial Jobless Claims Fall to 187,000: Robust labor market data provided solid fundamental backing for the Federal Reserve to sustain its tight monetary policy stance. The CME FedWatch tool showed the implied probability of a 25-basis-point rate hike in September spiking from 52% a week ago to 77%. Concurrently, the 10-year US Treasury yield climbed to 4.7%, setting a new year-to-date high. Higher opportunity costs for holding non-yielding precious metals continue to pressure gold and silver valuations.
Federal Reserve Enters Blackout Period Ahead of July FOMC Meeting: With officials restricted from public commentary, market participants proactively priced in hawkish policy outcomes. The US Dollar Index consolidated near highs while gold and silver, having accumulated substantial unrealized profits over four consecutive sessions of rebound, faced intense profit-taking at higher levels. As prices broke key technical support zones, concentrated stop-loss orders triggered a negative feedback loop that amplified short-term downside momentum, ending the previous rebound and pushing gold and silver into a rapid corrective phase.
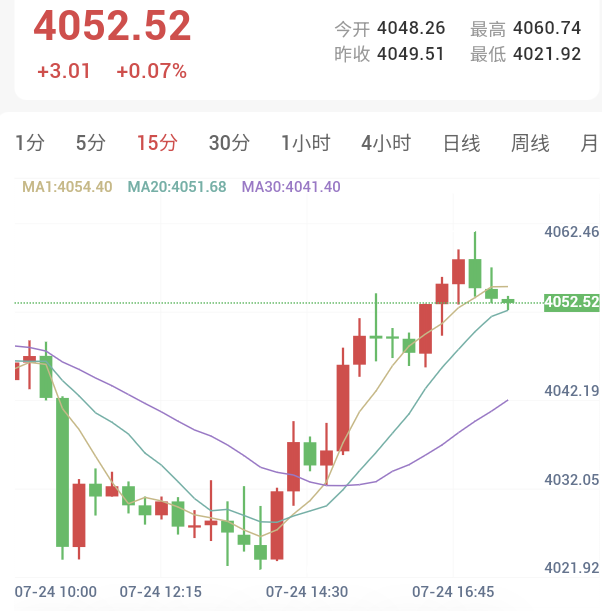
Gold Technical Analysis
Daily Chart: Gold opened at $4,448.26 per ounce during the Asian session, trading modestly lower intraday as short sellers exerted dominant control. Moving average systems remain in a bearish death cross alignment. A daily close below the 20-period moving average at $4,049.00 signals a short entry, with stop-loss set at $4,166.00 for a medium-term position.
Intraday Short-Term (15-Minute): Moving averages reflect a clear bearish alignment. A breakdown beneath the 20-period moving average at $4,042.00 provides a short entry, with stop-loss placed at the recent high of $4,051.00 and an exit targeted at a 2:1 risk-reward ratio.
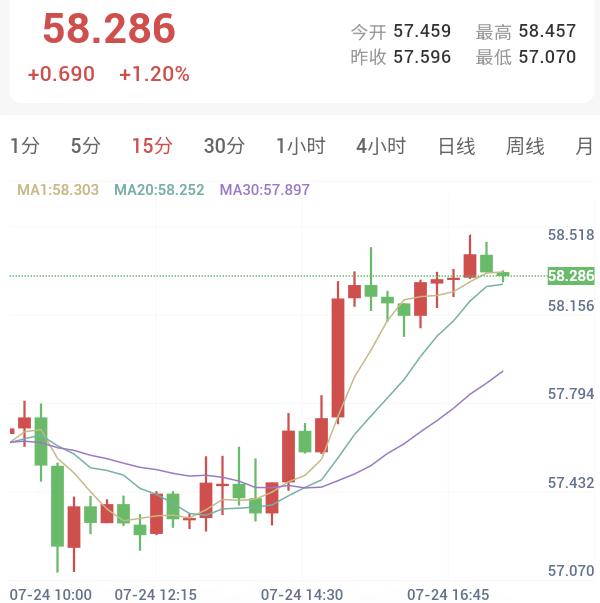
Silver Technical Analysis
Daily Chart: Silver opened at $57.459 per ounce today, trading lower in a low-level consolidation range. Moving averages maintain a bearish death cross orientation. A price break below the 20-period moving average indicates a short entry, with stop-loss reference set at the swing high of $60.920, aiming for a 2:1 risk-reward target or trailing moving average exit.
Intraday Short-Term (15-Minute): Moving averages remain in a bearish alignment. A move below the 20-period moving average at $57.519 provides a short entry, with stop-loss set near the relative peak at $57.900 and an exit targeted at a 2:1 risk-reward ratio.
Risk Warning
Financial market trading involves unpredictable risks, including but not limited to the loss of principal. This analysis is for reference only and does not constitute direct investment advice. Investors should make independent judgments and autonomous decisions based on their own risk tolerance.