

I. Market News Analysis
Rising US-Iran negotiation expectations drive sharp pullbacks in energy prices:
On August 2 local time, Trump announced the cancellation of a new round of strike plans against Iran, stating that an agreement over the Strait of Hormuz is in place and that US-Iran talks would commence on August 3. Market anxieties regarding Middle East conflict escalation cooled noticeably. Consequently, benchmark international energy prices dropped nearly 6% in a single session, retreating toward key price levels. The pullback in energy prices alleviated market concerns over stickier inflation rebounds.
Lingering hawkish divisions from the Fed's July policy meeting:
The July FOMC meeting saw three dissenting votes against holding rates, marking a first in nearly a decade. Chair Warsh reaffirmed commitment to the 2% inflation target, emphasizing that decisions do not rely on single-month data and retaining future rate hike options. Interest rate futures currently price in over a 65% probability of a 25-basis-point rate hike in September. The sustained high-interest-rate environment raises opportunity costs for non-yielding precious metals. With multiple Fed officials maintaining hawkish stances, policy tightening expectations have not fully dissipated, capping gold and silver's rebound momentum within a range-bound pattern.
II. Gold Technical Analysis
Daily Chart:
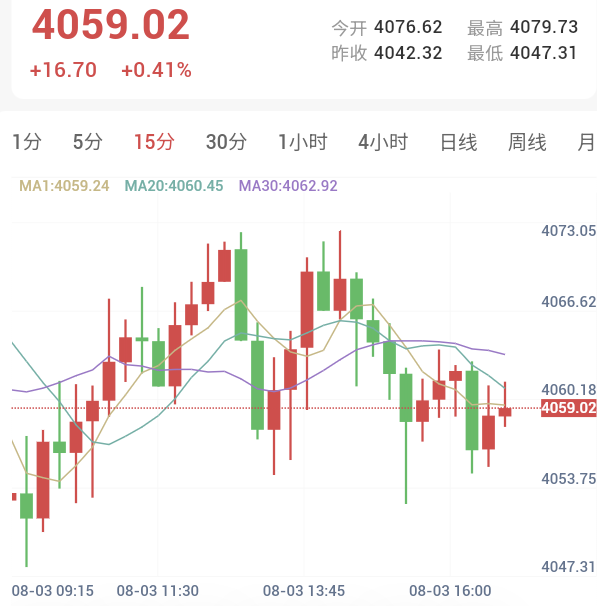
Spot gold opened at 4076.62 USD/oz in the Asian session, gapping higher before consolidating with a weak intraday trend. Moving averages remain in a bearish death cross alignment. Short positions entered around 4049.00 can be held, with stop-loss orders maintained near the previous high of 4166.00.
Intraday Short-Term (15-Minute Chart):
Moving averages currently display a bullish alignment. A breakout above the 20-period moving average near 4063.00 offers a long entry opportunity, with stop-loss references set at the recent low near 4054.00 and exit targets planned at a 1:1 risk-reward ratio.
III. Silver Technical Analysis
Daily Chart:
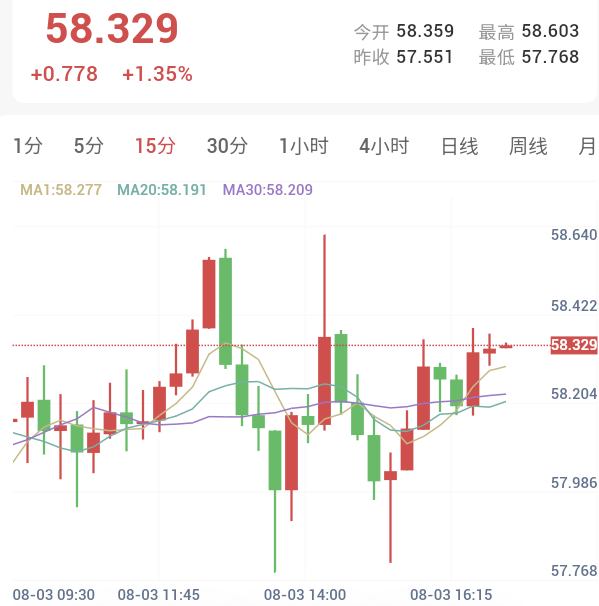
Spot silver opened at 58.359 USD/oz, trading in a narrow range without clear trend opportunities. Moving average death crosses lean bearish. Short positions initiated after breaching the 20-day moving average two days ago can be held, with stop-loss orders maintained at 60.911.
Intraday Short-Term (15-Minute Chart):
Moving averages present a bullish alignment while prices fluctuate between the 20-period and 80-period moving averages. Traders should wait patiently for prices to break above the 20-period moving average before taking long positions.
Risk Warning
Trading markets carry unpredictable risks, including but not limited to loss of principal. This analysis is provided for informational purposes only and does not constitute direct investment advice. Investors should make independent decisions based on their own risk tolerance.