

I. Fundamental Analysis
The US July ISM Manufacturing PMI spiked to 55.6%, significantly exceeding the expected 54.0% and the previous reading of 53.3%, marking its highest level since May 2022. The Prices Paid Index rose above 71.1%, highlighting renewed inflationary resilience in US manufacturing. This strength drove the Dow Jones Industrial Average to a fresh record high, while providing solid support for US Treasury yields and the US Dollar, placing direct pressure on non-yielding gold.
US President Donald Trump publicly stated on Monday that diplomatic discussions with Iran were underway, issuing a stern warning that this represents Tehran's last chance to sign an agreement to end the five-month conflict. However, Iranian official sources promptly issued a denial, clarifying that no negotiations are currently taking place or scheduled.
Deutsche Bank released a specialized research note reaffirming its fourth-quarter gold price target of 4,600 USD per ounce, stating that the preceding deep technical pullback has largely concluded.
Boosted by strong manufacturing data, equity risk appetite remains elevated. As the Super Non-Farm Payroll Week unfolds, market focus has shifted toward Wednesday's ADP private employment report and Friday's key US July Non-Farm Payrolls and unemployment rate data.
II. Multi-Timeframe Technical Analysis
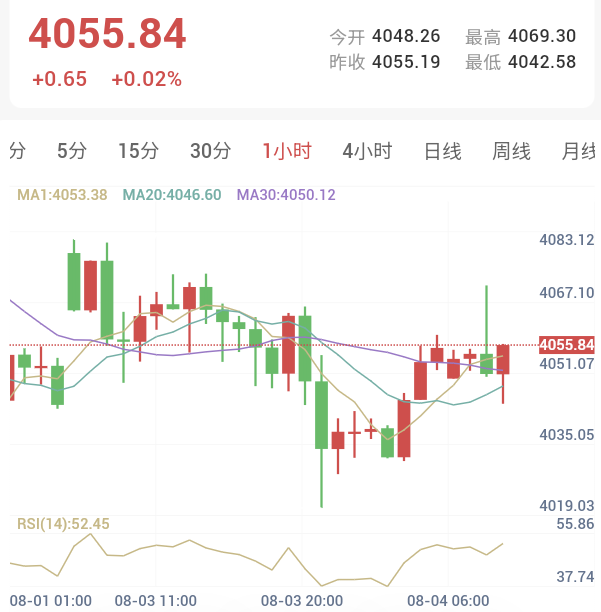
One-Hour Chart (Intraday Short-Term: Neutral Consolidation)
Trend Assessment: The one-hour timeframe shows narrow horizontal consolidation following a gap higher. Prices opened higher at 4080.00 USD yesterday morning, but bullish momentum lacked volume-driven expansion, leaving prices interweaving near short-term moving averages.
Indicator Tracking: RSI reads 52.45, reflecting momentum contraction.
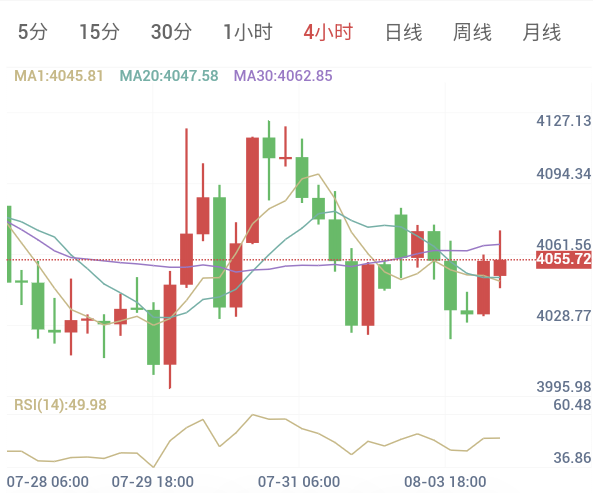
Four-Hour Chart (Medium-Term Trend: Neutral Range-Bound)
Trend Assessment: The four-hour structure remains classified as neutral range-bound. Prices fluctuate around the Bollinger Band middle line and moving average clusters. Although prices have avoided making new lows, medium-term momentum bars lack strong upward expansion, keeping rebound upside capped by overhead selling pressure.
Indicator Tracking: RSI reads 49.98.
III. Trading Execution Plan
Given that short, medium, and long timeframes are all classified as neutral range-bound, and considering that gold prices remain suppressed by strong US manufacturing PMI data while rebound momentum fades, intraday execution follows a sell-on-rallies strategy aligned with bearish analyst consensus:
Strategy Direction: Sell on Rallies (Trend Short)
Trading Signal: Sell
Confidence Index: 65 / 100
Entry Observation Zone: 4050.00 - 4110.00
Entry Midline: 4080.00
Stop-Loss Reference: 4124.48
Take-Profit Target: 3991.04
Risk-Reward Ratio: 1 : 2.00
Execution Details and Entry Rhythm:
The ideal execution rhythm involves waiting for price action to pull back higher toward the zone midline around 4080.00, or entering short positions in tranches if price bounces toward 4095.00 - 4110.00 encounter resistance (indicated by one-hour or 15-minute long upper wicks or bearish engulfing patterns).
Risk Warning
Trading markets carry unpredictable risks, including but not limited to loss of principal. This analysis is provided for informational purposes only and does not constitute direct investment advice. Investors should make independent decisions based on their own risk tolerance.