

I. Fundamental Market Analysis
Expected Bank of Japan rate hikes trigger widespread yen carry trade unwinding, sparking a sharp morning drop in precious metals.
On August 14, markets digested news that Japan's Prime Minister supports a central bank interest rate hike in September or October, causing the yen to appreciate rapidly. As a primary global funding currency, a strengthening yen forced investors to unwind carry trades, liquidating assets such as gold and silver to repay yen liabilities. Combined with technical profit-taking after recent price surges, spot gold fell over 0.8% during early trading to a low of $4,313 per ounce, while spot silver dropped over 1%, driving up short-term volatility.
Speculative funds take profits after favorable July inflation data, extending pullbacks from 2.5-month highs.
Following lower-than-expected July CPI and PPI readings, gold previously surged to $4,449 per ounce, touching its highest level since June 5. On August 14, speculative traders engaged in profit-taking. Coupled with technical resistance near the $4,400–$4,500 round-number threshold, spot gold retraced to near $4,320 per ounce while silver weakened in tandem.
US reaffirms maintenance of the Strait of Hormuz blockade as diplomatic talks stall, capping rebound potential due to energy supply risks.
On August 14, the US confirmed it will maintain maximum pressure on Iran through economic isolation and continuous maritime blockades. With navigation talks stalled, energy supply concerns linger, fueling fears of energy-driven inflation persistence that could delay Federal Reserve policy pivots. This offset safe-haven demand, keeping precious metals locked in a high-level, weak consolidation pattern.
Market pricing for a September Fed rate hike drops to 33%, relieving monetary pressure alongside structural central bank buying.
With July employment and inflation metrics cooling, market pricing for a September Federal Reserve rate hike dropped from 55% a week ago to 33%. Lower yield expectations reduce pressure on non-yielding metals. Meanwhile, sustained long-term gold purchases by global central banks provide strong underlying demand near key support levels, limiting deeper downside risks.
II. Gold Technical Analysis
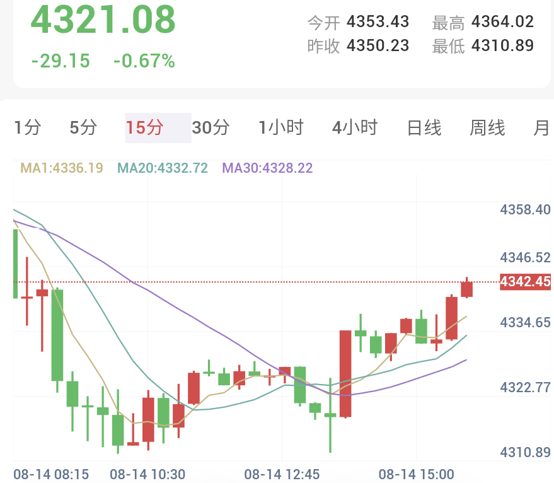
Daily Chart:
Opened at $4,353.93 per ounce in Asia, exhibiting a slight downward trend to an intraday low of $4,310.90 per ounce. Moving averages remain in a bearish death-cross alignment while price rests above the 80 MA. Traders should wait for technical convergence between price and moving averages before placing medium-term positions.
Intraday Short-Term (15-Minute Chart):
Moving averages show a bearish alignment, with price consolidating between the 20 MA and 80 MA. Exercise patience and await a clear breakdown below the 20 MA to evaluate short-side entry opportunities.
III. Silver Technical Analysis
Daily Chart:
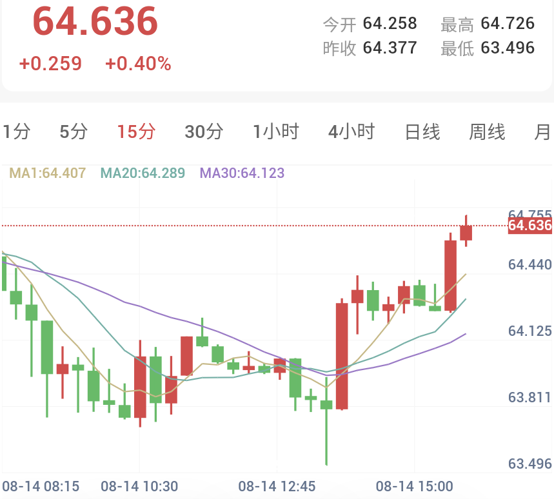
Opened at $64.460 per ounce, oscillating within a wide range without a clear directional trend. Moving averages maintain a bearish bias, with price positioned between double moving averages. Await clearer trend-alignment signals for medium-term positioning.
Intraday Short-Term (15-Minute Chart):
Moving averages display a short-term bearish structure with price positioned between the 20 MA and 80 MA. Await a break below key moving average supports before considering short positions.
IV. Risk Disclaimer
Financial markets carry inherent risks, including the potential loss of principal capital. This market analysis is for informational purposes only and does not constitute formal investment advice. Investors should evaluate strategies independently based on their individual risk tolerance.