

I. Fundamental Market Analysis
Weak US consumer metrics slash Fed rate hike odds:
US July retail sales dropped 0.6% MoM, well below forecasts, while UMich August consumer sentiment plunged from 55.2 to 51.0. These weak prints undermined arguments for immediate Fed rate hikes, pulling market-implied September rate hike odds down to approximately 31%.
Geopolitical tensions escalate as 60-day truce window expires:
The 60-day US-Iran negotiation window expires today with no extension agreement in sight. Unidentified projectile attacks on commercial vessels persist near the Strait of Hormuz, prompting the US Treasury to prepare unprecedented sanctions against Iran.
Rising energy prices cap spot gold upside gains:
Spurred by Strait blockade fears, Brent Crude surged ~6% and WTI gained ~5.4% over the week. Elevated energy benchmarks continue to exert inflationary cost-push pressure, capping immediate gold rallies.
II. Cyclic Technical Analysis
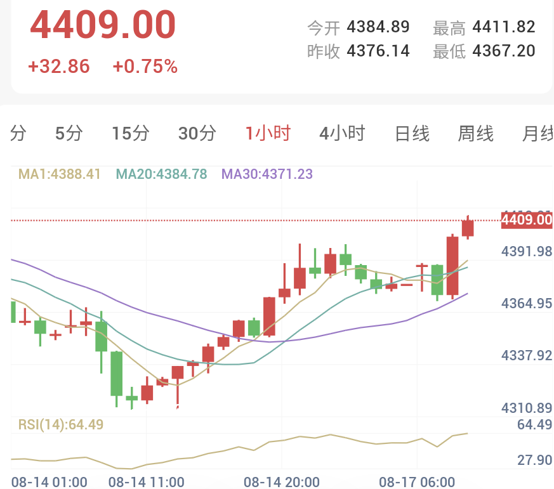
1-Hour Chart (Intraday Short-Term: Bullish Dominance / Strong Upside)
Trend Assessment: H1 charts display a sharp V-shaped breakout. After finding support near Friday's $4,311 low, gold reclaimed lost ground and breached the $4,400 psychological level. Prices hold firm above MA1 ($4,388.41), MA20 ($4,384.78), and MA30 ($4,371.23) with bullish moving average divergence.
Indicators: RSI(14) records 64.49, holding inside strong bullish territory without bearish divergence.
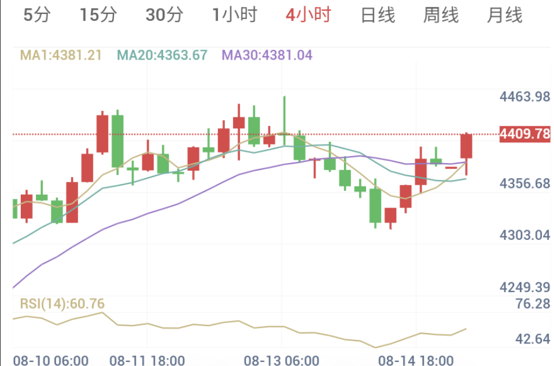
4-Hour Chart (Medium-Term Trend: Bullish Reversal Strengthening)
Trend Assessment: H4 charts show consecutive long bullish candles reversing prior pullback structures. Gold reclaimed MA1 ($4,381.21) and MA30 ($4,381.04) resistance zones, confirming renewed medium-term buying interest.
Indicators: RSI(14) surged back to 60.76 into bullish control.
III. Trade Execution Plan
Driven by weak US retail sales, plunging Fed rate hike odds, and strong technical breakouts on H1/H4 charts, a buy-on-dips strategy is recommended for today:
Strategy Direction: Buy on Dips (Trend Following)
Trading Signal: Buy
Confidence Index: 65 / 100
Entry Observation Zone: $4,365.00 - $4,441.00
Zone Midpoint (Core Entry Level): $4,403.00
Stop Loss Level: $4,350.00
Take Profit Target Zone: $4,509.00
Risk-Reward Ratio: 1 : 2.00
[Execution Details]
Gold trades near $4,409.00 following a rapid intraday rally. Traders should avoid chasing highs and wait for technical pullbacks during European trading sessions. Initiate long positions in tranches if price retraces toward the $4,403.00 midpoint or tests the $4,385.00 - $4,390.00 moving average support zone with reversal candlestick confirmation.
Risk Disclaimer
Trading markets carry inherent risks, including the loss of principal. This analysis is provided for informational purposes only and does not constitute investment advice. Investors should make independent decisions based on individual risk tolerance.