

I. Fundamental Analysis
Bond selloff drives US yields to multi-year highs: Gold experienced its sharpest single-day retreat since late July as global sovereign bonds faced severe selling pressure. The US 30-year Treasury yield touched 5.336%, its highest level since 2007, while the 10-year yield approached 4.75%, significantly elevating the opportunity cost of holding non-yielding bullion.
Middle East escalations re-ignite energy inflation risks: Tensions along the Strait of Hormuz escalated as vessel strikes caused casualties. Brent crude reached $91.63 per barrel and WTI posted its highest close since July 24, compounding macro inflation fears.
Markets await 7th FOMC Meeting Minutes: Investors focus on the upcoming Fed minutes following the 9-3 vote split in July. Any dovish signals regarding future rate paths could ease bond yield pressure and support spot gold, whereas persistent hawkish rhetoric would maintain downward pressure.
II. Technical Analysis
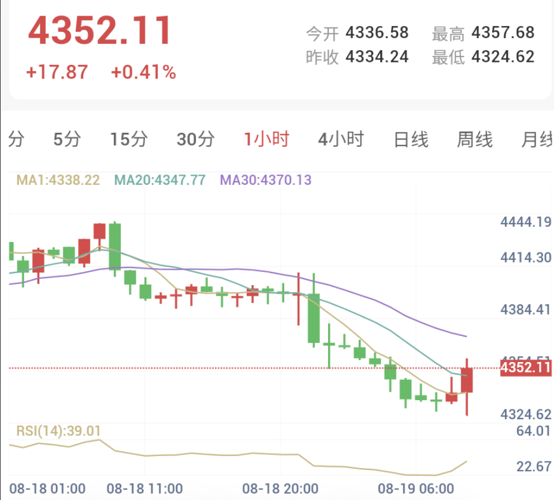
1-Hour Timeframe (Short-term: Bottoming out after oversold conditions)
Price Action: Spot gold stabilized around $4,352.11 following overnight selling. Prices hold above MA1 and MA20 while constrained by MA30, indicating short-term base building.
Indicators: RSI at 39.01, recovering moderately from oversold territory and signaling technical bounce potential.
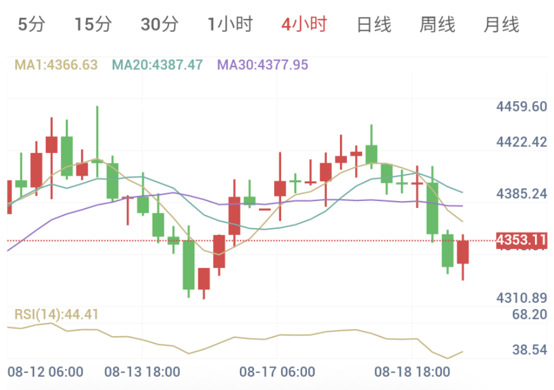
4-Hour Timeframe (Medium-term: Neutral to weak / Testing support)
Price Action: A sharp bearish candle broke prior high-level consolidation, pushing prices below MA1, MA20, and MA30. Short-term momentum favors sellers, though broader medium-term support remains intact.
Indicators: RSI at 44.41, oscillating in weak territory.
III. Trade Execution Plan
With gold showing signs of stabilization in the $4,330–$4,340 zone and oversold signals emerging on H1, a disciplined buy-on-dips strategy is favored:
Strategy Direction: Buy on Dips
Trading Signal: Buy
Confidence Index: 65 / 100
Current Price: ~4,352.11
Entry Observation Zone: 4,380.00 - 4,400.00
Median Entry Line: 4,390.00
Stop Loss: 4360.00
Take Profit Target: 4450.00
Risk-Reward Ratio: 1 : 2.00
Execution Details: Wait for a confirmed right-side breakout above $4,380.00–$4,390.00 on the H1/H4 timeframes before initiating long positions targeting $4,450.00.
Risk Disclaimer
Trading markets carry inherent risks, including the potential loss of principal. This analysis is for informational purposes only and does not constitute investment advice. Investors should make independent decisions based on their risk tolerance.