

I. Fundamental Analysis
U.S. Consumer Confidence Drops: The U.S. Consumer Confidence Index for August fell to 89.4, marking its lowest reading since January of this year. The sharper-than-expected weakness in economic data directly pushed U.S. Treasury yields lower across the board (with 2-year, 10-year, and 30-year yields declining noticeably). Federal funds futures pricing indicates the probability of keeping interest rates unchanged in September rose to 62.7%, while the rate hike probability receded to 37.3%.
Diplomatic Signs of De-escalation in Hormuz as Benchmark Energy Futures Retreat Significantly: Iran and Oman have begun discussions regarding the establishment of a "joint temporary shipping corridor" and joint mine-clearing projects. Although a benchmark energy tanker was struck by an unidentified projectile near Oman, global energy markets prioritized trading the "geopolitical de-escalation" narrative. West Texas Intermediate (WTI) crude futures dropped 3.1% to $82.36/bbl, while Brent crude plummeted 3.9%, breaking below the $90/bbl threshold.
Major Test Tonight: July PCE Inflation Data: At 20:30 Beijing time tonight, the U.S. will release the Federal Reserve's preferred inflation gauge—the July PCE Price Index—alongside the Second Estimate for Q2 GDP. Consensus forecasts currently project core PCE to print at 3.3% YoY.
II. Multi-Timeframe Technical Analysis
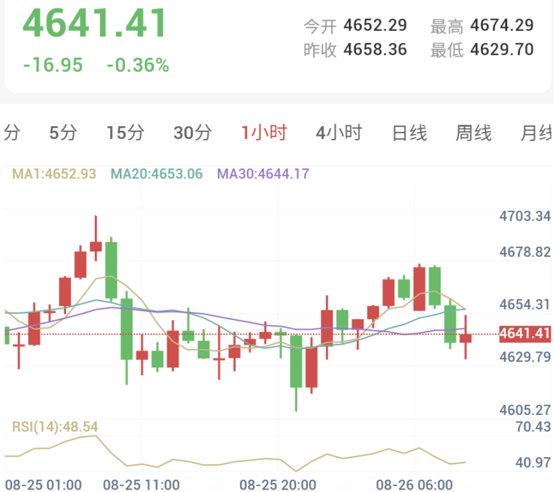
1-Hour Timeframe (Intraday Short-Term: High-Level Consolidation / Retracement Test)
Trend Evaluation: The H1 chart shows that after spiking toward $4,696, gold underwent a technical pullback, currently trading around $4,641.41. Short-term price action has broken below the MA1 and MA20 moving averages and is running tightly against the MA30, indicating that upward momentum has temporarily paused into a high-level consolidation phase.
Indicator Monitoring: RSI(14) prints at 48.54, falling from previous overbought territory into neutral-to-weak zone, reflecting a rebalancing phase between buyers and sellers.
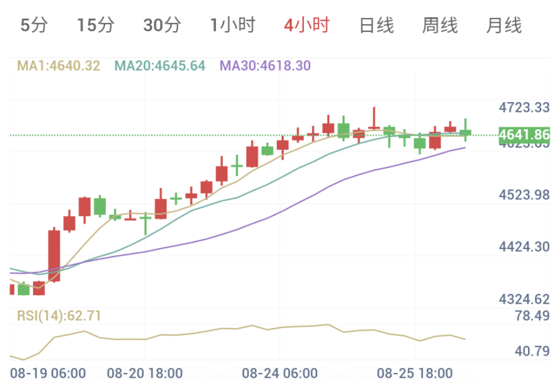
4-Hour Timeframe (Medium-Term Trend: Bullish Dominance / Strong Consolidation)
Trend Evaluation: The macro structure on the H4 timeframe remains firmly controlled by bulls. Despite short-term pullbacks, prices hold firmly above the support band formed by MA1 ($4,640.32), MA20, and MA30. As long as gold holds above the key moving average support between $4,610 and $4,618, the medium-term upward trendline remains fully intact.
Indicator Monitoring: RSI(14) prints at 62.71 in bullish territory, confirming medium-term momentum remains healthy.
III. Trading Execution Plan
Given that the H4 bullish structure remains intact and weak U.S. macro data has reduced rate hike probabilities, trading strategy continues to favor buy-on-pullback (trend following) despite short-term resistance near $4,700:
Strategy Direction: Buy on Pullback (Trend Bullish)
Trading Signal: Buy
Confidence Index: 85 / 100
Current Reference Price: ~$4,641.00
Entry Observation Zone: $4,620.00 - $4,715.00
Midpoint (Core Baseline): $4,667.50
Stop-Loss Reference: $4,594.50
Take-Profit Target: $4,813.50
Risk-Reward Ratio: 1 : 2.00
【Execution Details & Risk Control】
Data Risk Warning: Tonight's 20:30 PCE inflation release represents the week's major catalyst. Ahead of high-impact data, markets are prone to wide, volatile whipsaws. Single-trade risk exposure should be strictly capped at 5% of total account capital. Once open positions gain positive traction toward $4,700.00, trailing stop-loss orders should be adjusted to breakeven to protect capital.
Risk Disclaimer: Trading markets involve unpredictable risks, including the potential loss of principal. This analysis is for informational purposes only and does not constitute direct investment advice. Investors should evaluate independently based on their risk tolerance.