

Two Major Factors Pressure Gold Downward (2026/08/31)
1. Fundamental Analysis
Warsh Strikes Hawkish Tone, Sparking Friday Gold Sell-off:
Fed Chair Warsh explicitly stated in his Jackson Hole address that the Federal Reserve must bring inflation back to its 2% target. He noted that the labor market remains resilient and recent data does not yet prove a sustainable decline in inflation, meaning there is no need to halt rate hikes simply to protect employment.
Following his remarks, market expectations for a 25 bps rate hike in September surged from around 35% to 56.9%. The U.S. dollar and Treasury yields rallied in tandem, pushing gold down rapidly from near $4,630 to test $4,445.
Renewed Military Friction Between US and Iran:
U.S. forces launched an unexpected operation on Sunday, destroying Iranian military assets in the strait. Iran retaliated swiftly by targeting U.S. facilities in Jordan. As tensions in the Strait of Hormuz flared, energy futures jumped this morning, with Brent crude rising roughly 2% to reclaim the $90/bbl mark.
However, the fundamental drivers supporting gold throughout August have not entirely disappeared. The current movement reflects a sharp macro repricing rather than a confirmed long-term downtrend.
2. Multi-Timeframe Technical Analysis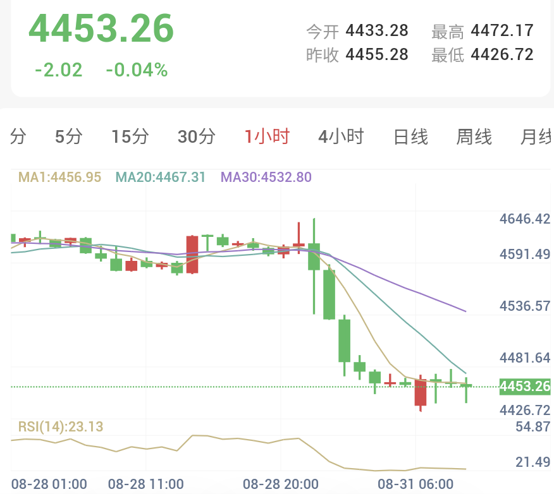
1-Hour Timeframe (Intraday: Deeply Oversold)
• Trend Assessment: The 1-hour chart shows gold trading near 4,453.26, with an intraday high of 4,472.17 and a low of 4,426.72. Prices remain below the MA1, MA20, and MA30 moving averages, which are fanning out in a bearish alignment. The previous consolidation zone near 4,590 has been broken to the downside, giving way to low-level consolidation following the sharp drop;
• Indicator Monitoring: RSI(14) is at 23.13, entering deeply oversold territory. While short-term momentum remains bearish, chasing short positions at current levels is unfavorable due to the risk of a technical rebound.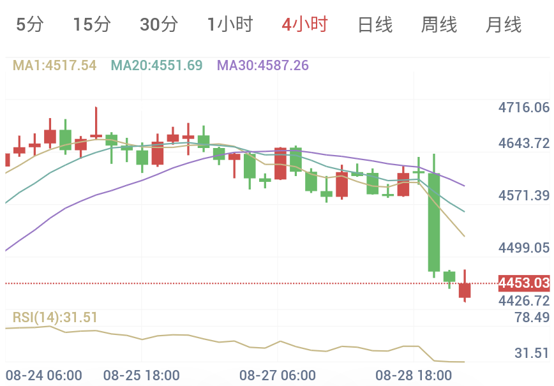
4-Hour Timeframe (Medium-Term: Bearish Dominance)
• Trend Assessment: On the 4-hour chart, price is suppressed below the MA1, MA20, and MA30 moving averages, maintaining an MA1 < MA20 < MA30 bearish alignment. Strong bearish candles have dismantled the previous high-level structure, confirming medium-term technical deterioration;
• Indicator Monitoring: RSI(14) stands at 31.51, approaching oversold levels. While the broader direction remains weak, the risk-to-reward ratio for selling breakdowns at current lows has deteriorated.
3. Trading Execution Plan
Given that 1-hour and 4-hour structures have weakened while short-term oscillators sit in oversold territory, today's strategy focuses on selling the rally rather than chasing shorts around 4,450.
• Strategy Direction: Sell on Rallies
• Trading Signal: Sell
• Confidence Index: 70 / 100
• Entry Observation Zone: 4,517.54 - 4,532.80
• Median Entry Level: 4,525.17
• Stop Loss Reference: 4,587.26
• Take Profit Target: 4,426.72
• Risk/Reward Ratio: Approx. 1 : 1.6
[Execution Details]
Gold has dropped from near 4,630 to the 4,450 area, pulling the 1-hour RSI down to around 23. Patience is required for a technical pullback to develop.
The ideal execution plan is to wait for price to retrace into the 4,517–4,533 resistance band, which aligns with the 4-hour MA1 and 1-hour MA30.
If price tests this zone and prints 1-hour long upper wicks, bearish engulfing patterns, or fails to sustain breaks above overhead levels, it signals that sellers are resuming control, validating short setups.
4. Risk Disclaimer
Financial trading involves substantial risks, including the potential loss of principal. This analysis is provided for informational purposes only and does not constitute direct investment advice. Traders should evaluate risks independently and make decisions accordingly.
Two Major Factors Pressure Gold Downward (2026/08/31)
Published: 2026-08-31 10:10:17