

US-Iran Conflict Reignites, Gold Plummets to 4,300 (2026/09/02)
1. Fundamental Analysis
Rate Hike Expectations Approach 70%, Treasury Yields Continue to Oppress Gold:
The hawkish influence from Warsh's recent remarks continues to ferment. Market expectations for a 25-basis-point rate hike by the Fed in September have further risen to 68%, and the U.S. 10-year Treasury yield has surpassed 4.80% today. The U.S. dollar, Treasury yields, and rate hike expectations are rising in tandem, placing strong downward pressure on gold. Last night, gold experienced a decline of over 2%, and it has further retreated to near $4,300 this morning.
Middle East Conflict Escalates, but Markets Focus on Inflation Risks First:
Military friction between the U.S. and Iran has escalated once again. Concurrently, transport risks in the Strait of Hormuz have increased, pushing Brent crude futures to $94.65/barrel and WTI futures to $90.22/barrel. Unlike previous instances, the market is currently more focused on the impact of rising energy costs on U.S. inflation. Consequently, geopolitical factors have not significantly bolstered gold; rather, they are further suppressing gold prices through the pathway of "rising energy costs —> elevated inflation expectations —> increased rate hike probability".
Tonight at 20:15 (Beijing Time), the August ADP employment data will be released. The market is watching to see if this can alter the current near-70% pricing for a September rate hike, while this Friday's Non-Farm Payrolls (NFP) report remains the ultimate directional pivot.
2. Technical Analysis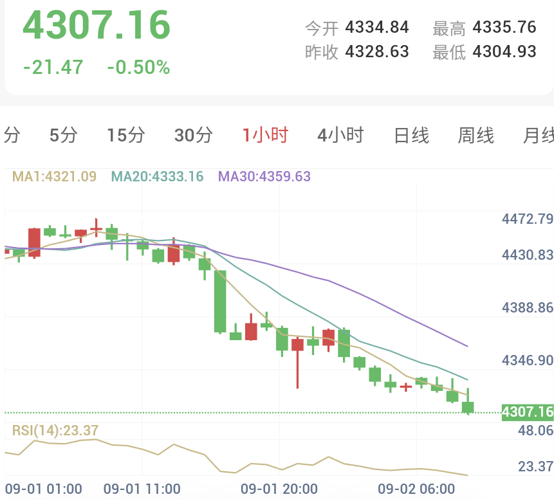
1-Hour Timeframe (Intraday Short-Term: Bearish Dominance / Deeply Oversold)
• Trend Assessment: The 1-hour chart shows gold currently trading near 4,307.16, with an intraday high of 4,335.76 and a low of 4,304.93. The price is clearly trading below the MA1, MA20, and MA30, with the three moving averages forming a distinct bearish alignment. Recent highs and lows continue to shift lower, maintaining bearish dominance.
• Indicator Monitoring: RSI(14) has dropped to 23.37, entering a pronounced oversold territory. Therefore, despite the weak trend, the risk of directly chasing shorts near 4,300 has significantly increased. In the short term, it is more appropriate to wait for a rebound to confirm overhead resistance.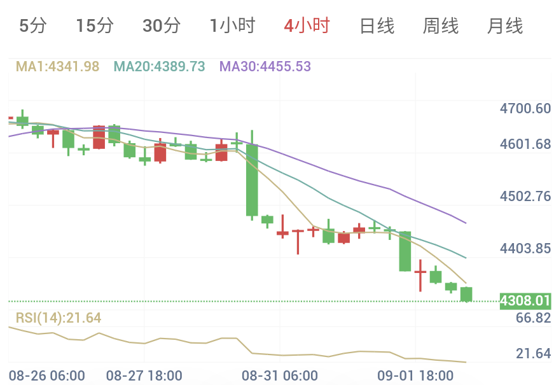
4-Hour Timeframe (Medium-Term Trend: Distinctly Bearish / Accelerating Oversold Conditions)
• Trend Assessment: The 4-hour moving averages continue to fan downward. The previous high-level consolidation structure has been broken by consecutive massive bearish candles, establishing a fairly clear descending structure.
• Indicator Monitoring: RSI(14) is recorded at 21.64, having entered a heavily oversold region. The trend remains bearish, but the likelihood of a technical rebound following the continuous rapid decline is increasing; thus, chasing the drop near 4,300 is not advisable.
3. Trading Execution Plan
Given that both the 1-hour and 4-hour timeframes maintain a clearly bearish structure, yet both are severely oversold, today's strategy adopts a plan to wait for a rebound before selling.
• Strategy Direction: Sell on Rallies
• Trading Signal: Sell
• Confidence Index: 75 / 100
• Entry Observation Zone: 4,340.00 - 4,347.00
• Median Entry Level: 4,343.50
• Stop Loss Reference: 4,360.00
• Take Profit Target: 4,300.00
• Risk/Reward Ratio: Approx. 1 : 2.6
[Execution Details]
Currently, gold has fallen to around 4,307, with both the 1-hour and 4-hour RSIs simultaneously entering oversold territory; therefore, continuing to chase shorts at current lows is not recommended.
The ideal rhythm is to wait for a technical rebound to return to the 4,340–4,347 zone. This area is close to the 4-hour MA1 at 4,341.98 and also serves as a pullback resistance zone following the 1-hour breakdown.
If price action enters this zone and forms a clear long upper wick, bearish engulfing pattern, or briefly breaks above only to fall back quickly, it can serve as confirmation of bearish continuation, allowing traders to target further downside.
Significant volatility may occur around the release of the ADP data at 20:15 tonight. Instantaneous intraday spikes piercing key levels should not be immediately viewed as valid breakouts; priority should be given to observing how the candlestick closes.
Risk Disclaimer
Financial trading involves unpredictable risks, including but not limited to the loss of principal. This analysis is for reference only and does not constitute direct investment advice. Investors should make independent judgments and decisions based on their own risk tolerance.