

Strong NFP Strikes, US-Iran Renew Fire (2026/09/07)
1. Fundamental Analysis
U.S. August Employment Notably Stronger Than Expected, Rate Hike Odds Rebound:
U.S. August non-farm payrolls added 162,000 jobs, significantly surpassing market expectations of approximately 56,000, while the unemployment rate remained at 4.1%; simultaneously, July's data was revised upward from a loss of 23,000 to a gain of 21,000. The resilience in employment has reinvigorated market expectations that the Fed will continue to tighten policy, with the probability of a September rate hike briefly climbing from around 50% to roughly 60%.
US-Iran Weekend Military Friction Escalates Again, Energy Prices Remain High:
Over the weekend, military actions between the U.S. and Iran occurred once more, further elevating shipping risks in the Strait of Hormuz. Brent benchmark energy prices are trading above $96 this morning. As geopolitical risks escalate, high energy costs also fuel concerns over reigniting inflation; thus, the market remains cautious regarding the future policy path.
U.S. Labor Day Today, Market Liquidity is Low:
Today, major U.S. cash markets are closed in observance of Labor Day, and trading hours for related markets have been adjusted. Consequently, intraday liquidity may be lower than on normal trading days, making short-term volatility more susceptible to amplification by sudden news. Moving forward, the market's focus will gradually shift to this week's U.S. PPI and CPI data to determine whether inflation will similarly support further policy tightening following the robust jobs report.
2. Technical Analysis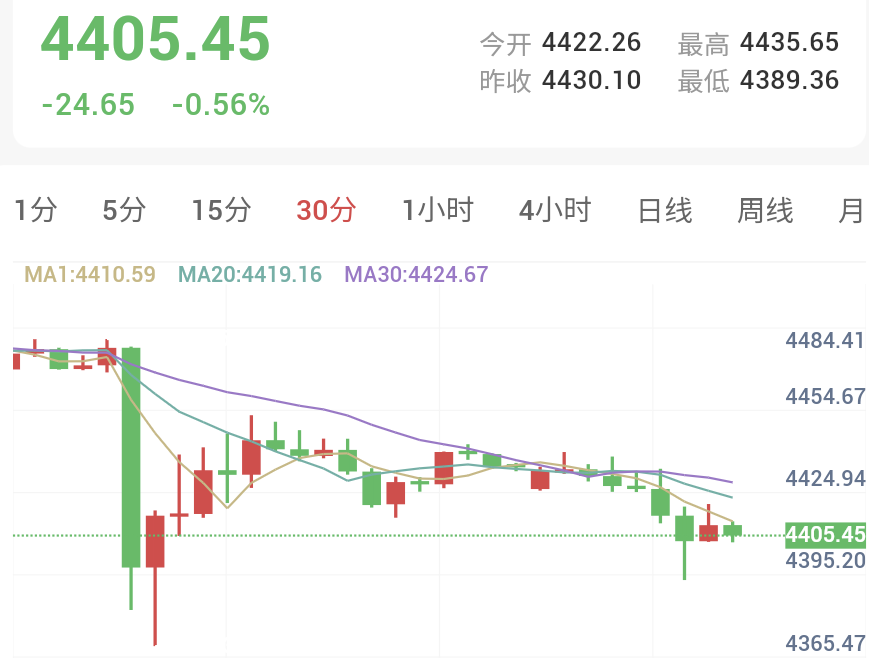
30-Minute Timeframe (Intraday Short-Term: Weak Rebound)
• Trend Assessment: The 30-minute chart is currently trading near 4,405.45, with the price situated below the MA1, MA20, and MA30, as the short-term moving averages collectively form overhead resistance. Although the sharp drop post-NFP has seen some recovery, the rebound height is increasingly capped. The relationship between recent highs and lows remains weak, and a definitive bullish structure has not yet formed in the short term.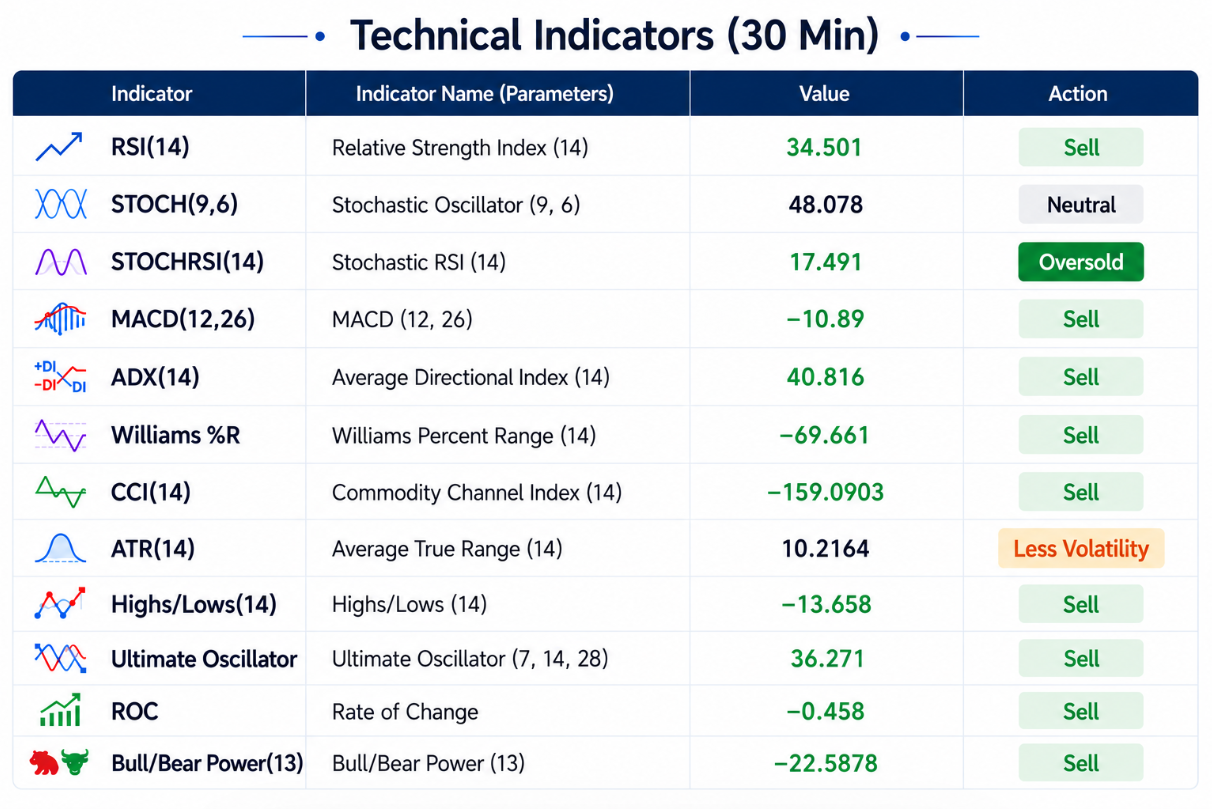
• Indicator Monitoring: The 30-minute technical indicators overall reflect a Strong Sell, with 9 sell signals and 1 neutral. RSI(14) registers at 34.50, MACD is at -10.89, and ADX has reached 40.82, indicating that the current downward momentum is still quite apparent. However, the STOCHRSI has entered oversold territory, making the risk-reward ratio for continuing to chase shorts at the current level relatively poor.
4-Hour Timeframe (Medium-Term Trend: Bearish Consolidation)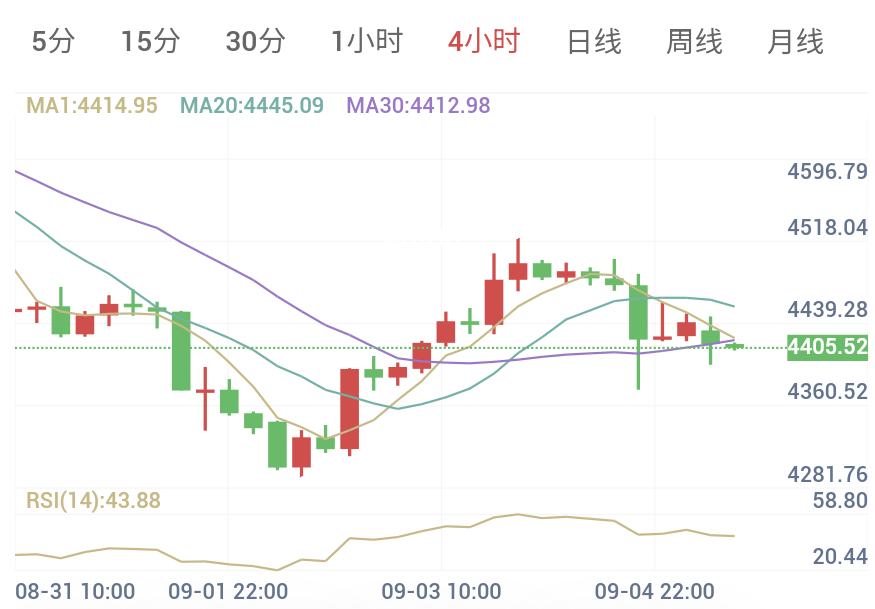
• Trend Assessment: The 4-hour chart is currently at approximately 4,405.52, with the price below the MA1, MA20, and MA30. The steep decline triggered after the NFP report broke the preceding rebound structure. Although the price subsequently stabilized, rebounds have consistently failed to hold above 4,440. The current state remains a weak consolidation following a drop.
• Indicator Monitoring: RSI(14) is recorded at 43.88, positioned below the neutral 50 centerline, indicating that 4-hour momentum remains weak.
3. Trading Execution Plan
Given that the 30-minute technical indicators are distinctly bearish and the 4-hour price remains below key moving averages, today's strategy adopts a single-condition plan to wait for a rebound before selling, avoiding direct chase-selling near 4,405.
• Strategy Direction: Sell on Rallies
• Trading Signal: Sell (Conditional Trigger)
• Confidence Index: 70 / 100
• Entry Observation Zone: 4,413.00 - 4,425.00
• Median Entry Level: 4,419.00
• Stop Loss Reference: 4,446.00
• Take Profit Target: 4,365.50
• Risk/Reward Ratio: Approx. 1 : 2.0
[Execution Details]
With the price having already retreated to near 4,405 and the 30-minute RSI approaching oversold territory, directly chasing shorts at these lows is not recommended.
The ideal rhythm is to wait for the price to rebound into the 4,413–4,425 zone. This area converges with overhead resistance near the 1-hour timeframe, the 30-minute MA20 and MA30, and is also close to the 4-hour short-term moving average resistance.
If price action enters this zone and produces a pronounced long upper wick, a bearish engulfing candle, or briefly breaks 4,425 only to fall back quickly, it can serve as confirmation of bearish continuation, allowing traders to monitor for downside opportunities.
Risk Disclaimer
Financial trading involves unpredictable risks, including but not limited to the loss of principal. This analysis is for informational purposes only and does not constitute direct investment advice. Traders should manage risk independently based on their own risk tolerance.