

I. Broad Slowdown in European Services Contraction

Latest data shows that the Eurozone services sector exhibited signs of improvement in June. The final Eurozone Services PMI released by S&P Global climbed significantly to 49.4 in June from 47.7 in May, topping the preliminary estimate of 48.9. Although the index has remained below the 50 boom-or-bust threshold for three consecutive months, the pace of contraction has narrowed noticeably.
Meanwhile, coupled with steady manufacturing growth, the final Composite PMI rebounded to 50.0 from May's 48.5, escaping contraction territory for the first time since March. This indicates that the broader European economy is beginning to stabilize following two months of decline.
A massive plunge in energy prices is the core driver pushing inflation lower. Excluding the COVID-19 lockdown period in 2020, service-sector input cost inflation logged its largest single-month drop since records began in 1998, sinking to a four-month low. This has vastly relieved the pressure on European Central Bank (ECB) policymakers to continue tightening monetary policy after launching their first rate hike in nearly three years in June.
II. Gold Sees High-Level Tug-of-War Volatility
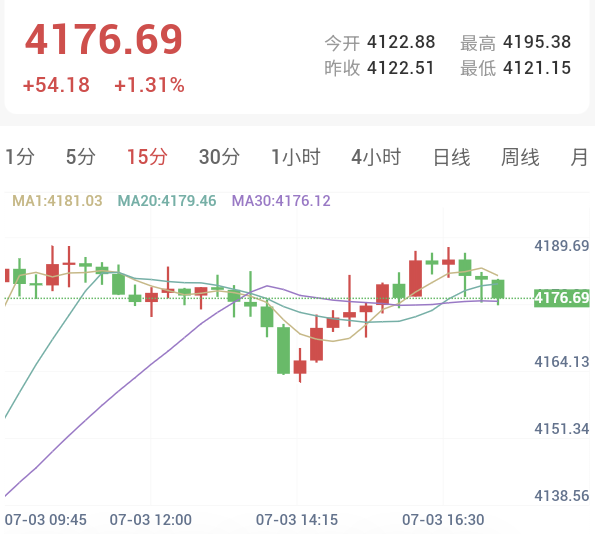
As of the afternoon session (Beijing Time), spot gold was trading at $4,176.69 per ounce, logging a massive intraday rally of 1.31% (up $53.84).
- Afternoon Technical Pullback: Around 2:00 PM Beijing Time, as the price encountered short-term profit-taking pressure above the $4,190 handle, gold experienced an organic technical pullback, with prices briefly testing lower and carving out a localized low.
- Currently, the price is tracking firmly above the MA30 ($4,176.02) and sits closely to the MA1 ($4,181.70) and MA20 ($4,178.70). The three short-term moving averages have begun to flatten and converge following intense volatility.
III. Technical Indicators Return to a Neutral, Healthy Zone
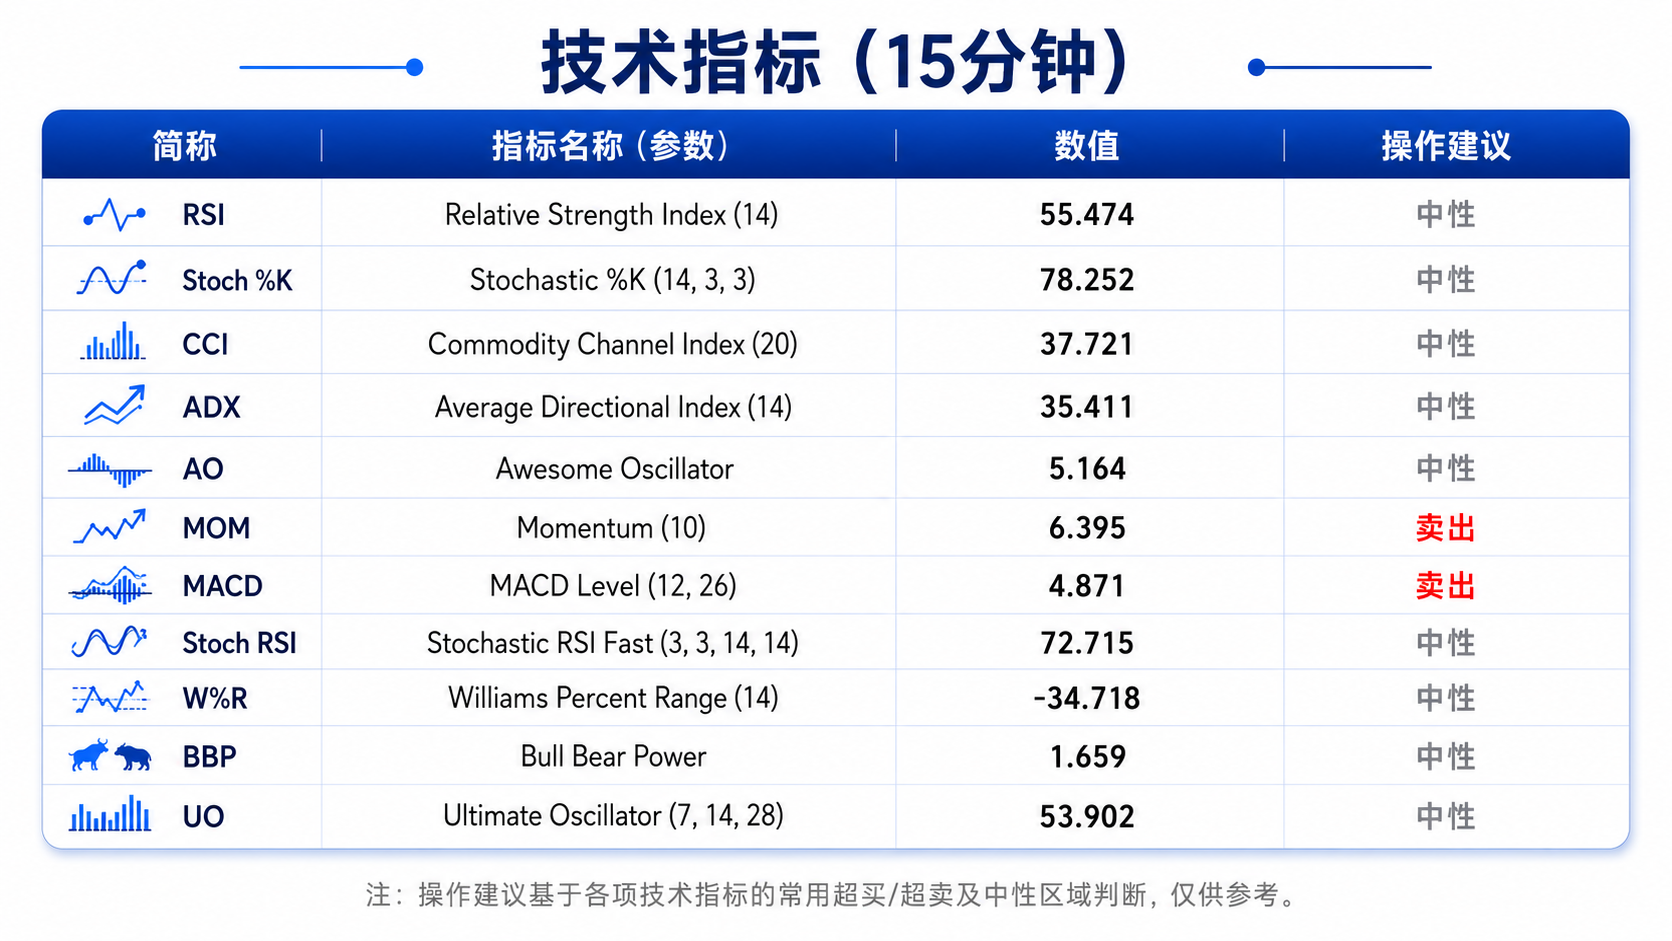
According to the latest 15-minute technical indicators, as gold narrowed its fluctuations in late trading, all oscillators have fully returned to healthy ranges:
- Core Oscillators Remain Neutral: The Relative Strength Index (RSI 14) stands at 55.474, the Stochastic %K tracks at 78.252, and the Commodity Channel Index (CCI 20) is at 37.721. These readings indicate a balance between bullish and bearish forces in the current market.
- Short-Term Correction Momentum Stays Mild: The more sensitive Stochastic RSI Fast stands at 72.715, while the Williams Percent Range sits at -34.718, with both running mildly around the bullish median line. This technically supports gold's rebound from its afternoon low.
- Trend Indicators Show One-Sided Momentum Converging: The Average Directional Index (ADX 14), which measures trend strength, shows a neutral reading of 35.411. The Awesome Oscillator prints at 5.164, while the medium-term directional indicator, the MACD, prints at 4.871 signaling a sell. This indicates that the steep slope of the morning's one-sided rally has been corrected by the afternoon's sideways consolidation, with the chart shifting into a range-bound accumulation pattern.
IV. Gold Market Outlook
Overall, the rebound in the Eurozone's June Services PMI and the epic, rapid cooling of inflationary pressures—paired with the recent slowdown in US non-farm payrolls—are systematically eroding the confidence of major global central banks to maintain aggressive tightening through the second half of the year. This systemic easing of macro liquidity pressures provides a solid macroeconomic foundation for non-yielding gold to build a bottom and rebound.