

Maritime Tracking Data Highlights Traffic Slowdown Across Dual Chokepoints

On Monday, newly released shipping tracking data from commodity intelligence firm Kpler revealed that despite the US-Iran military confrontation entering a tactical ceasefire over the weekend, transit capacity across the Middle East's two core energy shipping chokepoints remains severely constrained.
Data showed that following armed attacks against Saudi refining and storage facilities along the Red Sea coast in Jizan and Yanbu, only 11 commercial vessels navigated through the Bab-el-Mandeb Strait on Sunday, falling to the lowest level in months. Concurrently, daily vessel transits through the Strait of Hormuz remained at a depressed level of under 10 ships over the weekend.
Although select Very Large Crude Carriers (VLCCs) loaded with bulk energy are departing the Red Sea bound for Asian consumer markets, persistent capacity obstructions across both straits pushed spot procurement costs for liquid fuels in the Middle East, Europe, and Africa to nearly two-month highs.
These structural bottlenecks in physical transit corridors prevent long-term sticky inflation concerns from dissipating rapidly, providing underlying structural support for macroeconomic pricing across financial markets.
Broad Price Tug-of-War as Moving Averages Highly Converge
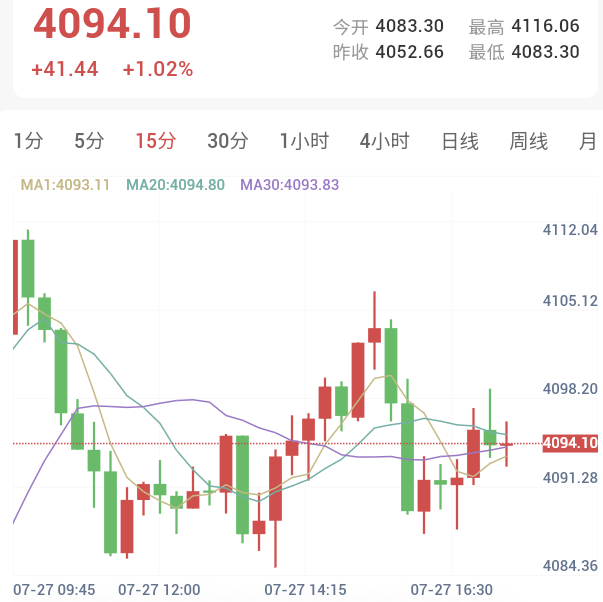
As of approximately 17:40 Beijing time on July 27, spot gold was trading at $4,094.10 per ounce, up 1.02% intraday (gaining $41.44), consolidating smoothly around the $4,094 level.
Early Session Spike and Afternoon Pullback: Gold opened today at $4,083.30 per ounce. Driven by the pause in US airstrikes alongside lingering geopolitical uncertainty, bullish capital launched an early assault, spiking to an intraday high of $4,116.06 per ounce. During the afternoon, as short-term profit-taking emerged, price action executed a stepped technical retracement to find support near a localized low of $4,084.36 per ounce.
Moving Averages Converge Tightly: The current MA1 ($4,093.11), MA20 ($4,094.80), and MA30 ($4,093.83) moving averages have clustered into a highly tight, flattened convergence zone within an extremely narrow band between $4,093 and $4,095 per ounce. Price candles are currently grinding horizontally against these three short-term moving averages, with the steep early-morning slope fully absorbed by afternoon rangebound consolidation.
Short-Term Technical Indicators Display Divergence and Oversold Reading
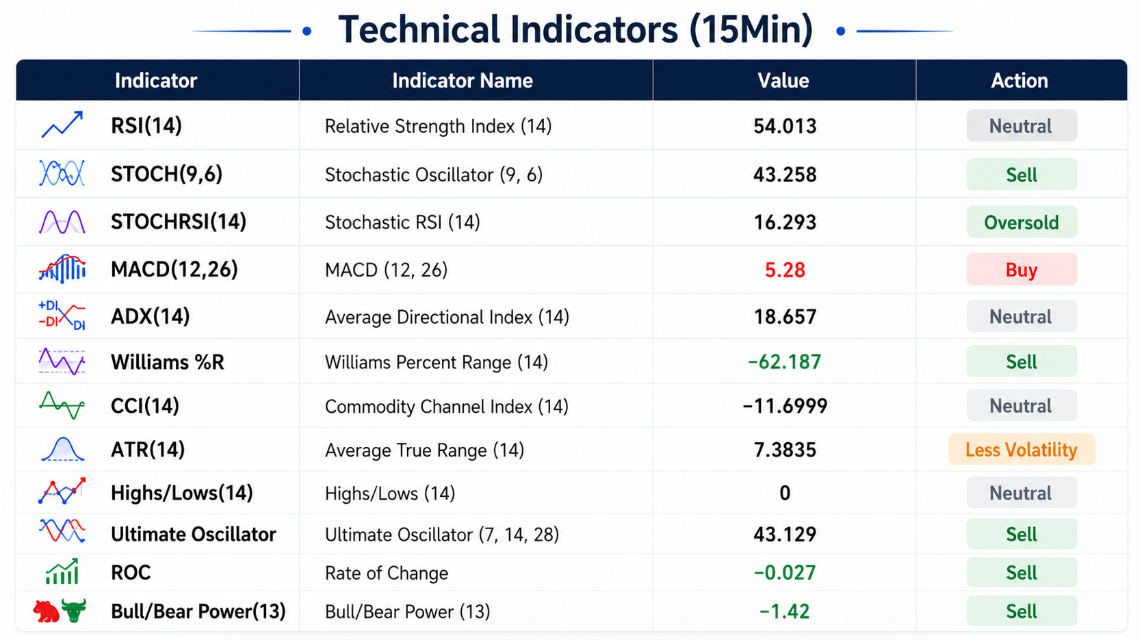
According to 15-minute technical indicator data as of 17:40, gold's pullback from the $4,116.06 peak shifted overall technical ratings to a mildly bearish Sell (1 bullish metric, 4 neutral, 5 bearish), though sensitive oscillators reached localized oversold levels.
Core Oscillators Return to Neutral Territory: The broad Relative Strength Index RSI(14) reads 54.013, while the Commodity Channel Index CCI(14) registers -11.6999, with both returning precisely to neutral territory. The Average Directional Index ADX(14) stands at a low 18.657, demonstrating that single-direction breakout momentum transitioned into low-level rangebound consolidation during the afternoon.
Short-Term Sensitive Indicators Enter Oversold Zone: The Stochastic RSI Fast printed 16.293, dropping directly into extreme oversold territory, while the medium-term direction metric MACD Level holds at 5.28 with active buy prompts. This indicator divergence suggests that while short-term profit-taking pulled prices back from intraday highs, the broader technical foundation remains intact, signaling short-term requirements for technical position turnover.
Market Summary
In summary, gold markets today are shaped by the interplay of the US-Iran tactical ceasefire and severe shipping obstructions across key straits (with Kpler data showing Bab-el-Mandeb transit hitting multi-month lows). Macroeconomically, physical supply chain bottlenecks sustain underlying inflation expectations; technically, the 15-minute MA1, MA20, and MA30 moving averages are tightly clustered between $4,093 and $4,095, with gold prices consolidating horizontally near $4,094.10 as technical metrics display ADX trend deceleration alongside localized Stochastic RSI oversold readings.