

I. Inflation Concerns Escalation
Geopolitical stability across the Middle East deteriorated further on Thursday afternoon. Following a fresh wave of large-scale US airstrikes on Wednesday targeting dozens of military and command installations—including Kharg Island—Iran launched multiple missiles toward Jordan, which were intercepted by Jordanian defense systems. Concurrently, US and Saudi joint forces conducted strikes against Iranian-aligned targets in eastern Iraq.
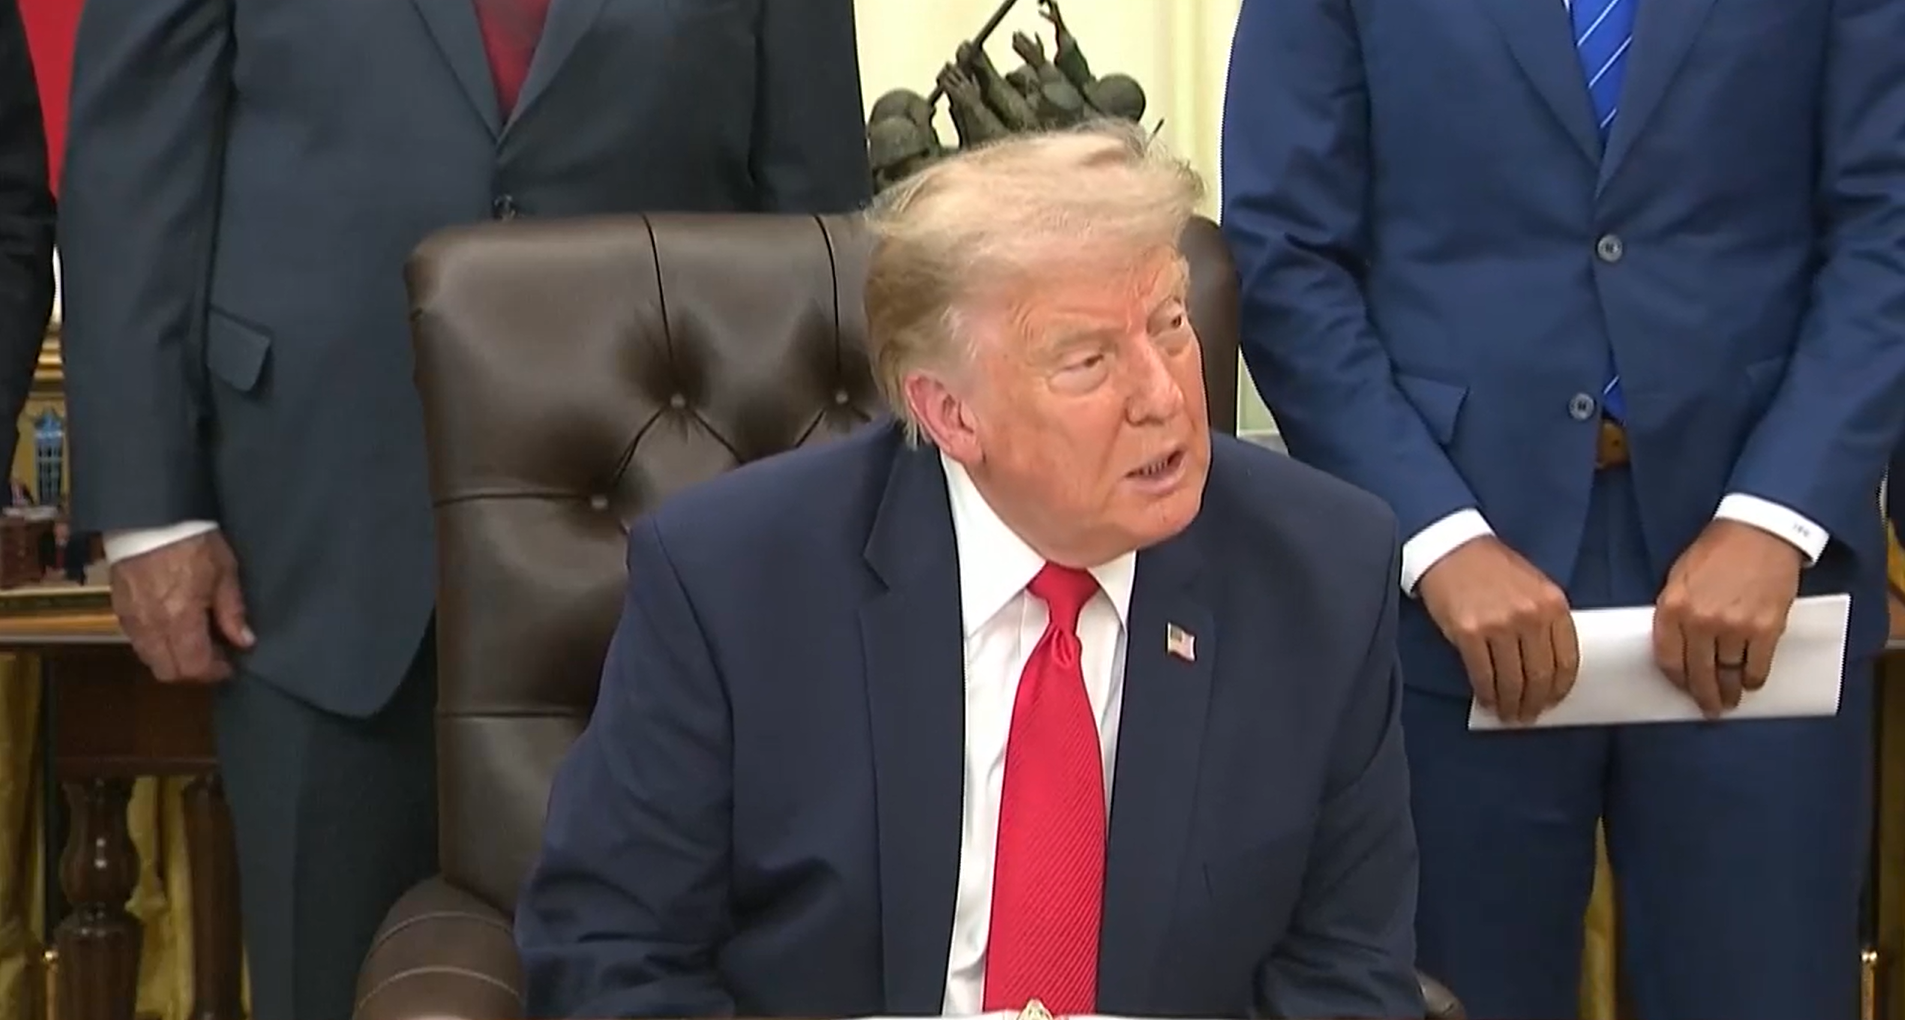
President Trump remarked at the White House that the US would hit Iran "very hard," stating "so it's our turn" while promising a heavy strike, even as he reiterated Washington's intention to continue pursuing a diplomatic framework with Tehran.
Mediterranean Gas Infrastructure Attacked: Maritime security agencies confirmed that a US-owned floating storage and regasification unit at Damietta Port along Egypt's Mediterranean coast was struck by a drone attack, triggering fires that spread to adjacent vessels. This development marks a geographic expansion of the five-month conflict beyond the Persian Gulf, directly threatening energy supply arteries in the Mediterranean.
II. Intraday Pullback and Moving Average Resistance
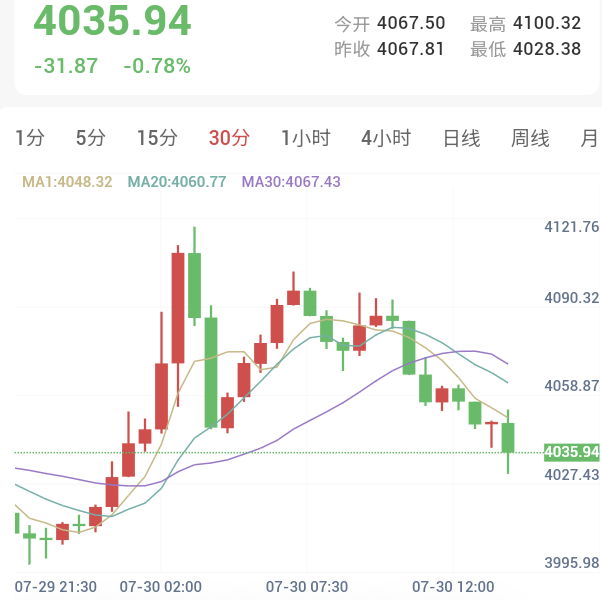
As of approximately 13:46 Beijing time on July 30, spot gold traded at $4,035.94 per ounce, down 0.78% (-$31.87 on the day), breaching the $4,040 threshold to hit an intraday low of $4,028.38 per ounce.
Afternoon Weakness: Gold opened at $4,067.50 and touched an intraday high of $4,100.32 before reversing course sharply. Prices staged a step-like decline throughout the afternoon, breaking key support levels at $4,080, $4,060, and $4,040 toward the $4,028.38 low.
Moving Average Alignment: The short-term MA1 ($4,048.32), MA20 ($4,060.77), and MA30 ($4,067.43) have developed a clear downward bearish divergence. As price action broke decisively below this cluster during afternoon trading, the three moving averages now hover above current price action, serving as dynamic overhead resistance.
III. 30-Minute Technical Indicators Signal Strong Sell
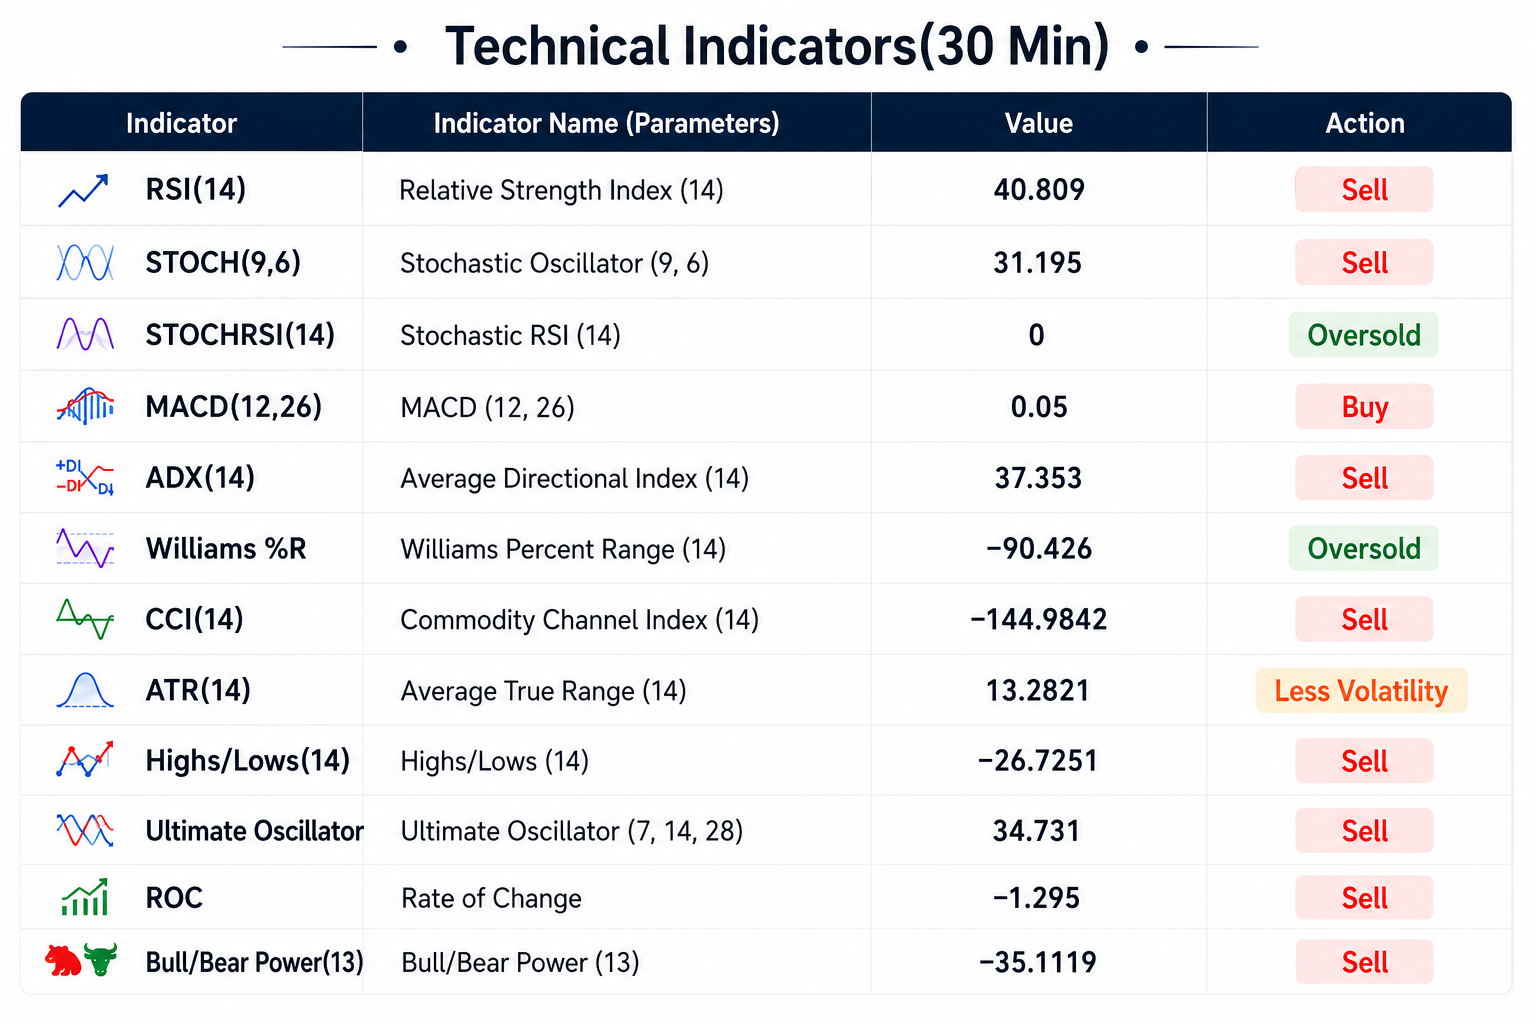
According to 30-minute technical indicator readings at 13:46, gold's afternoon decline solidified an overall rating of Strong Sell (1 bullish, 0 neutral, 8 bearish). While sellers maintain control, short-term sensitive oscillators have entered extreme oversold territory.
Bearish Trend and Momentum Readings: The Relative Strength Index RSI(14) fell to 40.809, while the Commodity Channel Index CCI(14) printed -144.9842, both signaling bearish bias. The Average Directional Index ADX(14) registered 37.353 alongside sell indicators, confirming strong downward trend momentum.
Extreme Oversold Conditions on Sensitive Oscillators: The Stochastic RSI Fast dropped to 0.000 while the Williams Percent Range reached -84.397, pushing deep into oversold territory. This suggests that immediate selling pressure has released significantly following the break below $4,040, indicating technical room for low-level consolidation.
Market Summary
Overall, gold price action on Thursday reflects the compound impact of geopolitical conflict expanding into Mediterranean Egyptian ports, missile interceptions over Jordan, and Iran's rejection of joint Gulf transit initiatives. On the macro front, structural risks across energy supply channels sustain inflation persistence and support higher-for-longer central bank rate expectations.
On the technical front, the 30-minute chart shows MA1, MA20, and MA30 forming resistance between $4,048 and $4,067, with gold testing support near $4,035.94 amid strong sell momentum coupled with deeply oversold Stochastic RSI conditions.