

I. The US Dollar Weakens Sharply
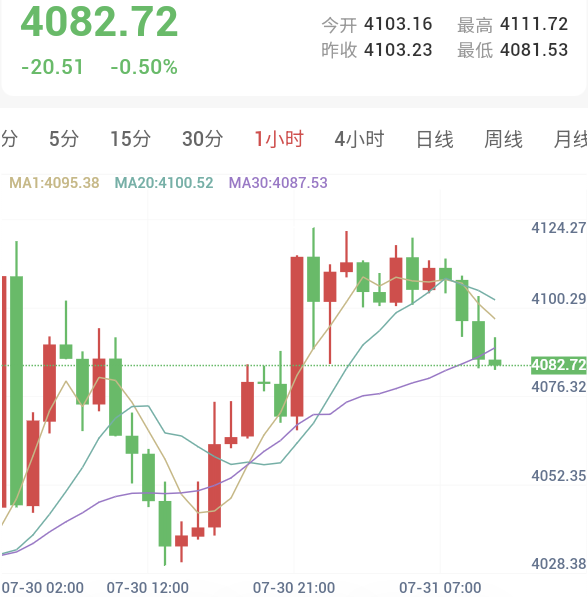
In early Asian trading on July 31, spot gold surged toward the $4,100 threshold before pulling back, currently trading near $4,082.72 per ounce.
On July 30, catalyzed by the Federal Reserve's rate decision and a wave of macroeconomic data, spot gold breached the $4,100 resistance mark to reach an intraday high of $4,120.08 per ounce, setting a new one-week high before softening due to high-level profit-taking.
II. Sharp Yen Volatility Drags Down the US Dollar Index
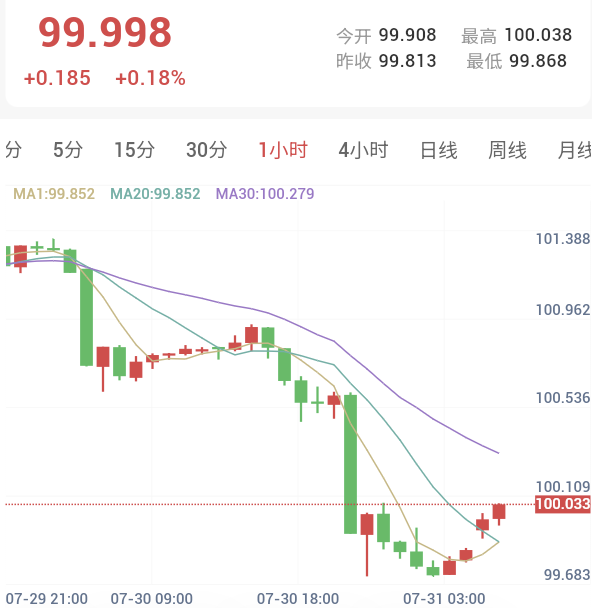
Extreme volatility gripped global markets on July 30, with the US Dollar Index (DXY) plunging nearly 0.90% intraday to briefly slip below the 100 mark to 99.90 points. A weaker greenback reduced holding costs for foreign buyers of dollar-denominated bullion.
The primary catalyst driving dollar weakness was a dramatic surge in the Japanese Yen. During the July 30 New York session, USD/JPY plunged by nearly 500 pips within a single hour, posting a peak intraday decline of 3.3% to hit a two-month high of 157.80 yen per dollar. Market participants reacted to potential coordinated intervention by monetary authorities in Japan and the US.
Nikkei reports confirmed that Japanese government authorities and the Bank of Japan conducted joint yen-buying and dollar-selling operations, alongside parallel procedures by US monetary authorities. Intense exchange-rate volatility and the subsequent pullback in the dollar provided monetary support for precious metals.
III. June PCE Inflation Moderates
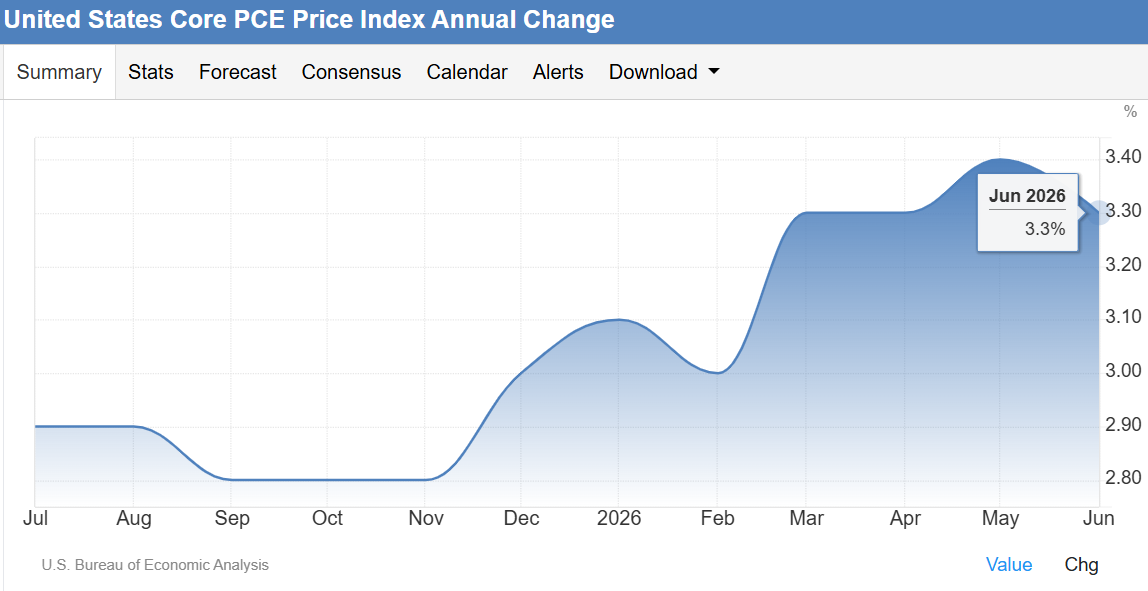
Data released on July 30 by the Bureau of Economic Analysis at the US Department of Commerce showed the June Personal Consumption Expenditures (PCE) price index dropped 0.1% month-over-month, marking the first monthly decline since 2020. The year-over-year PCE rate narrowed from 4.1% in May to 3.7%. Excluding food and energy, the core PCE index rose 0.1% month-over-month, coming in below expectations of 0.2%, while the annual core rate cooled from 3.4% to 3.3%.
The cooling inflation print directly reshaped market pricing regarding the Fed's policy trajectory. According to the CME FedWatch Tool, traders reduced the probability of a 25-basis-point Fed rate hike in September from 77% prior to the meeting down to 61%.
IV. Second-Quarter GDP Growth Misses Forecasts
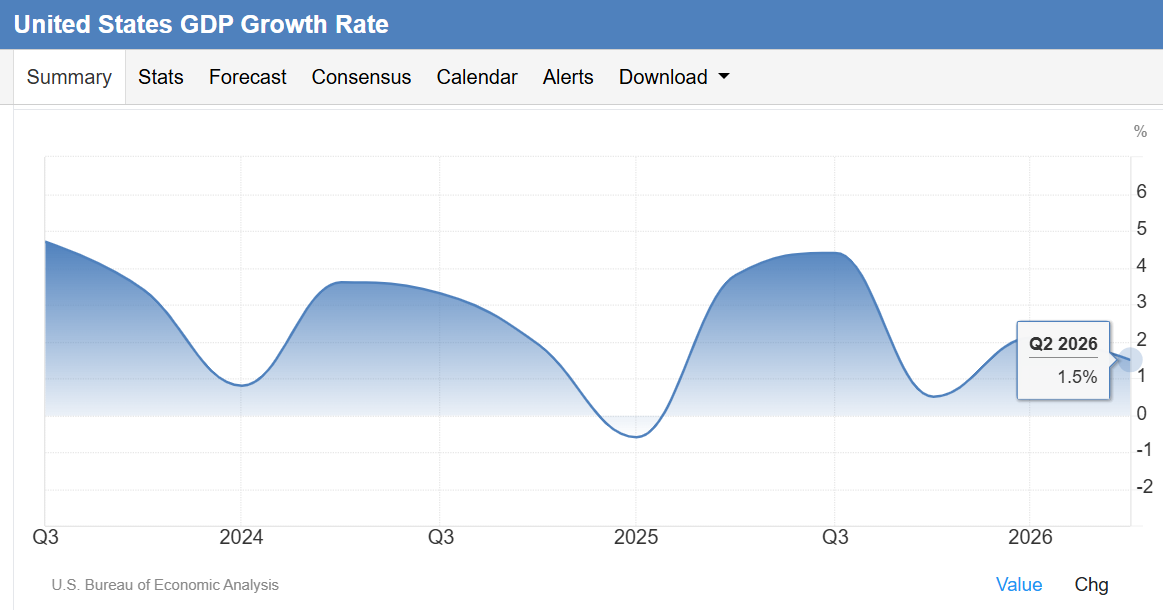
Advance GDP estimates for Q2 2026 published on the same day revealed that annualized US GDP growth reached 1.5%, trailing market expectations of 2.1%, while Q1 GDP growth was revised to 2.1%. Net exports proved to be the principal drag on growth, subtracting 1.01 percentage points from the headline rate.
Nevertheless, underlying domestic demand exhibited resilience. Consumer spending, which accounts for over two-thirds of US economic output, expanded by 3.2% in Q2 compared to 0.5% in Q1. Business equipment investment surged 15.2%, marking a second consecutive quarter of double-digit expansion driven largely by tech enterprise capital expenditure in AI data centers and computational capacity.
V. Gas Carriers Attacked Near Suez Canal
Geopolitical tensions escalated on July 30 as two natural gas carriers caught fire following drone strikes near the Egyptian port of Damietta, adjacent to the Suez Canal. The affected vessels included the Energos Winter gas storage vessel owned by a US company.
Simultaneously, exchange airstrikes between US forces and the Islamic Revolutionary Guard Corps (IRGC) continued. US forces targeted military command centers and drone facilities inside Iran, while Iranian forces claimed retaliatory strikes against US facilities at Jordan's Muwaffaq Salti Air Base and Kuwait's Ali Al Salem Air Base.
In addition, Saudi Arabia conducted joint airstrikes with US forces against armed groups in eastern Iraq for the first time, while Iran asserted that it maintains operational control over the Strait of Hormuz. Maritime transit risks and multi-nation geopolitical friction continue to underpin safe-haven demand for precious metals.
VI. Battle Intensifies Around the $4,100 Threshold
From a technical perspective, gold encountered firm resistance after spiking above $4,120 before retreating below $4,100. Technical overhead resistance is concentrated in the $4,150–$4,200 band, while immediate downside supports sit at $4,050 and the $4,000 psychological handle.
Institutional analyses from TD Securities and peers note that elevated long-term borrowing costs continue to exert pressure on gold prices. However, persistent central bank gold accumulation, expanding sovereign debt loads, and broader de-dollarization trends provide structural support. The World Gold Council highlighted in its latest report that investment demand driven by asset diversification and geopolitical hedging will remain a core anchor for the gold market.