

I. Conflicting Signals on US-Iran Peace Talks Intertwine with Maritime Transit Risks

On Tuesday, as the United States and Iran released highly contradictory signals regarding the state of diplomatic negotiations, the macro pricing environment in global financial markets plunged back into a complex stalemate. US President Donald Trump publicly stated that peace talks with Iran were underway, calling it the "last chance" for Tehran to sign an agreement. However, the Iranian Ministry of Foreign Affairs promptly issued a firm denial, asserting that no meetings or contacts of any kind had been scheduled or conducted with the US side, and that ongoing discussions remained strictly limited to bilateral maritime management with Oman.
This sharp divergence in policy signals, compounded by a sudden security incident confirmed by the United Kingdom Maritime Trade Operations (UKMTO)—where a commercial cargo vessel off the coast of Oman was struck by an unknown projectile—underscores the continued vulnerability of physical transit through critical Middle Eastern maritime choke points.
II. Price Action Advances in Step Pattern Supported by Bullish Moving Averages
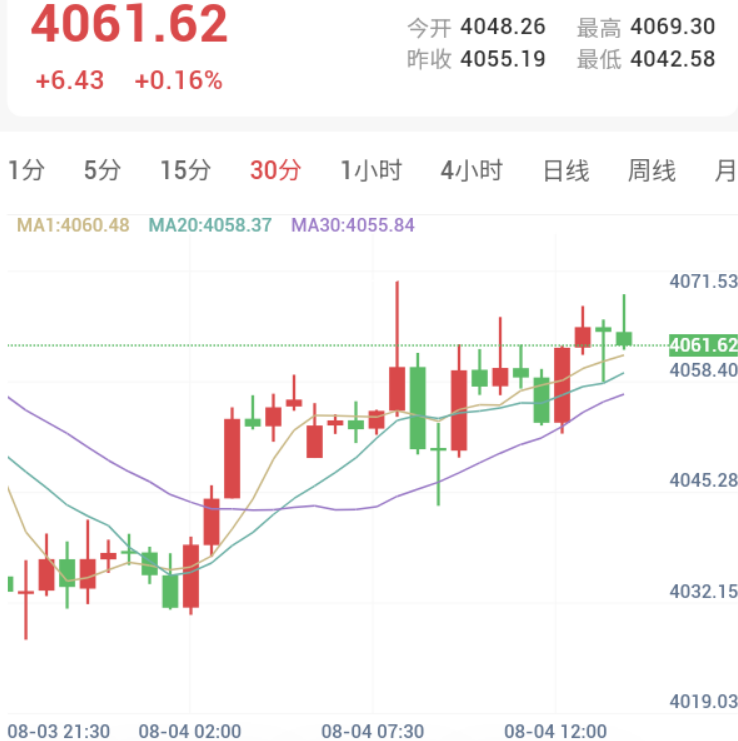
As of 13:45 Beijing Time on August 4, spot gold was trading at 4061.62 USD per ounce, up 0.16% (a gain of 6.43 USD) on the day, successfully establishing a foothold above the key 4060 USD threshold.
Early session troughing and step-like rebound:
Gold opened today at 4048.26 USD, quickly attracting buying support after dipping to an early session low of 4042.58 USD. Price action subsequently staged a step-like recovery marked by successive bullish candles, pushing to an intraday high of 4069.30 USD before consolidating near 4061.62 USD.
Moving average system forms bullish golden cross support:
The 30-minute chart clearly reveals that the MA1 (4060.48 USD), MA20 (4058.37 USD), and MA30 (4055.84 USD) have all turned upward following early low-level convergence, forming a robust dynamic support zone spanning 4055 USD to 4060 USD.
Price candles are trading firmly above all three moving averages, indicating that the short-term market structure has established a healthy technical floor following the breakout above 4060 USD.
III. 30-Minute Technical Indicators Signal Strong Buy
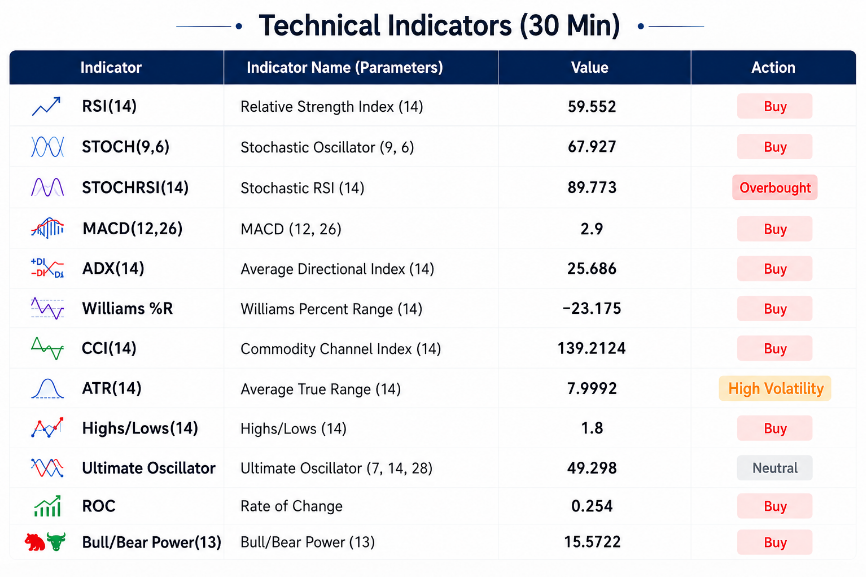
According to the latest 30-minute technical indicator data, gold's step-like rally from 4042.58 USD and steady holding above short-term moving averages yielded an overall Strong Buy rating (9 bullish, 1 neutral, 0 bearish), reflecting clear bullish dominance in short-term positioning.
Core oscillators maintain steady bullish stance:
The Relative Strength Index RSI(14) printed at 59.552, holding within a clear bullish advantage zone; the Stochastic Oscillator STOCH(9,6) registered 67.927 to maintain a buy signal; the Commodity Channel Index CCI(14) posted 139.2124, and the Williams Percent Range Williams %R recorded -23.175, all remaining well within bullish control territory.
Trend and momentum indicators show full alignment:
The medium-term MACD Level(12, 26) printed at 2.90 with ongoing buy signals; the Average Directional Index ADX(14) posted 27.787 in buy status, indicating healthy volume and institutional capital continuity behind the advance; Bull/Bear Power printed at 15.5722, maintaining a positive posture. The fast Stochastic RSI(14) printed at 89.773 in local overbought territory, signaling high-level position turnover following the steep short-term ascent.
Summary
In summary, the gold market today was driven primarily by the resonance of highly conflicting signals regarding US-Iran peace talks and the missile strike on a commercial vessel near the Omani coast. On the macroeconomic front, diplomatic uncertainty combined with choke point maritime risks continues to preserve a fragile balance between geopolitical tension and inflation expectations.