

I. Macro Headlines: Escalation in the Strait Halts Diplomatic Progress

Diplomatic negotiations over the Strait of Hormuz hit a fresh stalemate on Tuesday following commercial vessel attacks across the Red Sea and the Gulf of Oman, paired with escalating rhetoric between US and Iranian officials. In the Bab el-Mandeb Strait, an attack on a cargo vessel resulted in four crew fatalities—marking the first deaths of the current conflict. Concurrently, US military helicopters fired missiles at a Panama-flagged vessel in the Gulf of Oman for attempting to breach blockades.
On the diplomatic front, senior Iranian official Mohsen Rezaei stated that the Strait of Hormuz will remain closed unless the US unfreezes Iranian assets and halts regional military threats.
US President Trump responded firmly, asserting full US operational control over the strait and warning of severe economic collapse or military action against Iran. Iran also claimed it is developing operational capabilities on enemy soil, elevating regional geopolitical risks.
II. 30-Minute Chart Analysis: Pullback Following Peak at 4,416.08 USD
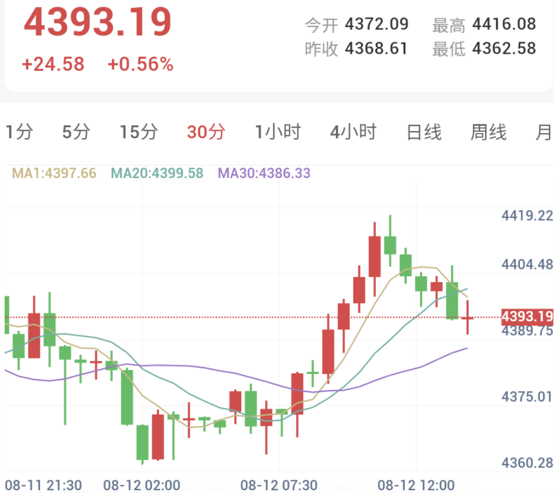
Spot gold opened at 4,372.09 USD/oz and dipped to an intraday low of 4,362.58 USD during early morning trading. Driven by geopolitical headlines, aggressive buying pushed prices upward in a step-like rally, printing an intraday peak of 4,416.08 USD.
However, as rising energy prices stoked fears of renewed inflation and prolonged central bank rate tightness, upside momentum dried up above 4,410 USD. Selling pressure forced a pullback toward 4,393.19 USD. MA20 (4,399.58 USD) provides dynamic overhead resistance, while MA30 (4,386.33 USD) provides baseline support.
III. Technical Indicators: Momentum Reverts to Neutral
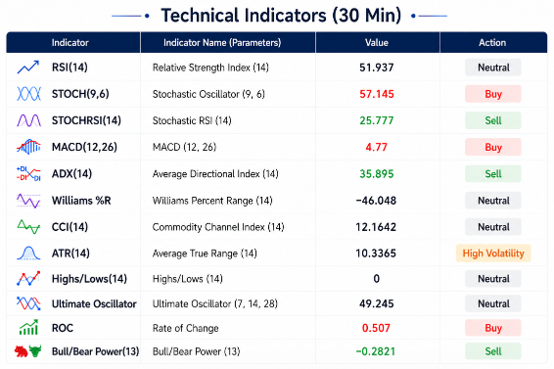
Following the pullback from intraday highs, technical evaluations shifted from bullish to Neutral (3 buy, 5 neutral, 3 sell signals), reflecting a balanced stance around the 4,390 USD level:
Core Oscillators Hover in Neutral Territory:
RSI(14) prints at 51.93, anchored near the 50 neutral midpoint
CCI(14) reads 12.16, remaining in neutral territory
Williams %R sits at -46.04, reflecting balanced momentum
Ultimate Oscillator prints at 49.24, showing neutral momentum
Short-Term Momentum Divergence:
STOCH(9,6) registers 57.14, maintaining a mild buy bias
StochRSI(14) drops to 25.77, entering weak momentum territory
Trend Strength Indicators Signal Exhaustion:
ADX(14) reads 35.89, issuing a trend weakness sell signal
MACD(12,26) stands at 4.77, with histogram bars contracting significantly
Macro tightening fears forced the market into a consolidation band ahead of catalyst events.
IV. Market Summary
Renewed maritime attacks and rigid US-Iran political rhetoric have pushed diplomatic talks into a stalemate. Energy price rallies reinforced expectations for persistent inflation and prolonged high interest rates, capping gold's upside momentum. The 30-minute technical chart demonstrates a pull-back from 4,416.08 USD, with indicators returning to neutral.