

I. Failed Negotiations Solidify Hawkish Policy Stance

Diplomatic efforts in the Middle East suffered a major setback on Thursday as senior Iranian sources confirmed zero progress regarding the revival or implementation schedule of the June interim agreement. Iranian officials firmly denied rumors of a 60-day negotiation extension, noting that US compliance collapsed within 48 hours of the original agreement.
Regarding maritime transport, while US President Trump claimed total control over the Strait of Hormuz, Iranian maritime authorities reiterated that the waterway remains blockaded and will not reopen without full US compliance. The breakdown in diplomacy, alongside ongoing maritime attack reports, keeps global benchmark energy prices volatile at elevated levels.
II. 30-Minute Chart Analysis: Gold Faces Pressure Below Moving Averages
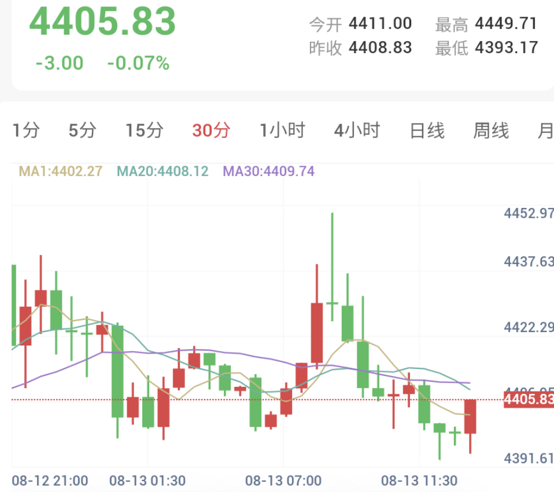
Spot gold displayed a weakening pattern after facing resistance at higher levels. Opening at 4,411.00 USD/oz, prices initially surged to an intraday high of 4,449.71 USD before aggressive selling emerged amid hawkish policy expectations.
Gold subsequently trended downward, breaching support levels at 4,420 USD and 4,410 USD to hit a low of 4,393.17 USD before stabilizing around 4,405.83 USD. MA20 (4,408.12 USD) and MA30 (4,409.74 USD) exert immediate dynamic overhead resistance, positioning price action firmly below key averages.
III. 30-Minute Technical Indicators: Bearish Trend Dominates with Oversold Signals
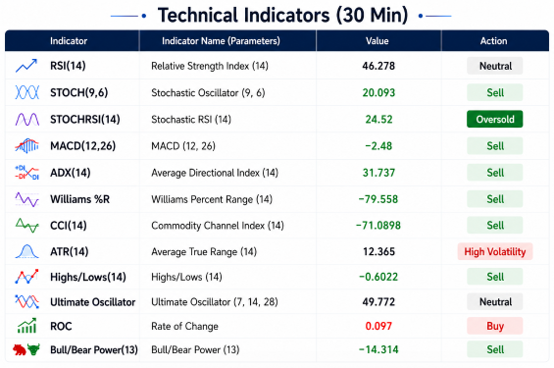
Technical metrics reflect a strong sell bias as bearish momentum leads short-term price action:
Trend and Moving Averages Maintain Bearish Pressure:
MACD(12,26) prints -2.48, continuing to issue sell signals
ADX(14) registers 31.74 with bearish momentum confirmation
Core Oscillators Hover in Weak Territory:
RSI(14) prints 46.28, remaining below the 50 neutral threshold
Ultimate Oscillator prints 49.77 in neutral territory
Sensitive Indicators Reach Oversold Bands:
StochRSI(14) records 24.52 in oversold territory
STOCH(9,6) records 20.09 in oversold territory
Technical alignment confirms that hawkish policy expectations weigh on broader gold structures. However, oversold readings following the decline toward 4,393 USD suggest selling pressure has partially vented, pointing toward short-term technical consolidation above key support.
IV. Conclusion
In summary, stalled diplomatic negotiations and persistent maritime blockades keep energy prices elevated, reinforcing monetary tightening expectations and placing downward pressure on gold. The 30-minute chart shows prices capped below MA20 and MA30, maintaining a weak trend while short-term oversold indicators suggest consolidation needs. Investors should monitor whether gold establishes firm support above the 4,390 USD level.