

I. News & Fundamental Events

On Tuesday, the U.S. Department of the Treasury officially announced a new round of sanctions targeting 60 individuals, entities, and vessels. Treasury Secretary Bessent warned that nations continuing to trade with Iran risk being expelled from the U.S. dollar financial system, though he noted a grace period would be provided for affected countries and firms to cut ties, with Chinese financial institutions not directly designated at present.
In response to expanded U.S. economic sanctions, Iran's Minister of Economy and the Islamic Revolutionary Guard Corps (IRGC) issued strong statements pledging retaliation and warning that "the enemy should await the attack." Nevertheless, despite the tense geopolitical climate, global benchmark energy prices pulled back noticeably on Tuesday.
Concurrently, ahead of Wednesday's U.S. Personal Consumption Expenditures (PCE) price index release and Federal Reserve Chair Warsh's upcoming key address at the Jackson Hole symposium, bond yields jumped higher. Pressured by hawkish policy expectations prior to data publication, gold bulls opted to lock in profits, causing gold prices to pull back from three-month highs.
II. 30-Minute Chart Analysis
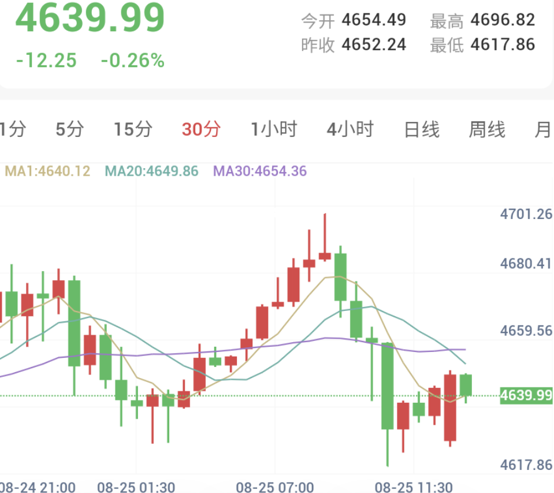
As of 13:45 Beijing time, spot gold trades at $4,639.99/oz, down 0.26% (-$12.25) on the day.
Early in the session, gold spiked to a multi-month high of $4,696.82. However, heavy sell orders subsequently emerged, resulting in consecutive red candles in a step-like downward trajectory to an intraday low of $4,617.86. After touching the low, price action displayed a mild technical bounce before moving into horizontal consolidation.
From a moving average perspective, alongside the swift price retracement, both the MA20 ($4,649.86) and MA30 ($4,654.36) have turned downward, building a clear dynamic resistance band overhead. Current price action is attempting to test the MA1 ($4,640.12) upward, but overall chart structure remains temporarily controlled by bears.
III. 30-Minute Technical Indicators
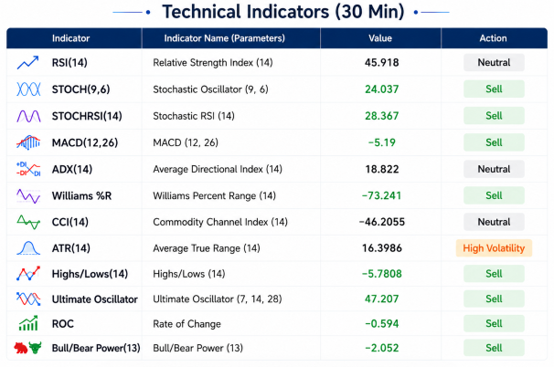
On the 30-minute technical indicator front, overall market evaluation has shifted to "Strong Sell" (0 bullish, 3 neutral, 8 bearish), with core indicators signaling short-term weakness:
Core Oscillators Remain Weakly Neutral:
Relative Strength Index RSI(14) prints at 45.92, and Commodity Channel Index CCI(14) registers at -46.21, both running in neutral-to-weak territory below the 50 centerline, reflecting weak buying interest.
Momentum & Trend Indicators Signal Downside Bias:
Medium-term momentum indicator MACD(12,26) stands at -5.19, continuing to release sell signals;
Trend strength indicator ADX(14) prints at 18.82 in neutral territory, indicating that the downward slope has moderated after touching intraday lows, shifting into consolidation.
Sensitive Indicators Approach Oversold Territory:
Stochastic RSI StochRSI(14) records 28.37,
Williams %R prints at -73.24, both issuing sell signals while gradually approaching low-level oversold territory.
After spiking to $4,696.82, short-term selling pressure took dominance. Although the ADX shows downside momentum has somewhat moderated, rebound momentum remains sluggish, leaving the chart vulnerable to a secondary retest after meeting resistance at overhead moving averages.
IV. Summary
Overall, expanded U.S. sanctions and Iran's retaliatory threats failed to push benchmark energy prices higher. Fading energy prices eased fears of accelerating inflation, which, combined with market caution ahead of key U.S. PCE inflation data and Fed Chair Warsh's speech, prompted gold to pull back from multi-month highs. Currently constrained by overhead MA20 and MA30 resistance, technical indicators remain broadly weak. Key factors to watch next include tomorrow night's U.S. PCE guidance and whether gold can hold its intraday low support at $4,617.86.