

Iran Plans Exclusion Zone as Gold Dips Toward 4,404 Level
1. News & Geopolitical Events
Over the weekend, military confrontations in the Middle East escalated noticeably, marking a new phase in the standoff between the U.S. and Iran:
• Iran Establishes "Economic Warfare Command": Iranian officials announced the establishment of a specialized agency to confront economic challenges arising from sanctions. The speaker of Iran's parliament issued a stern warning stating that the rules have changed, and any subsequent attacks will be met with "faster, heavier, and more painful retaliation."
• Direct Maritime Clashes Erupt: U.S. Central Command confirmed that after the Islamic Revolutionary Guard Corps fired ballistic missiles at two U.S. Navy vessels, American forces struck three Iranian vessels on Saturday, including one near the crucial Kharg Island energy hub.
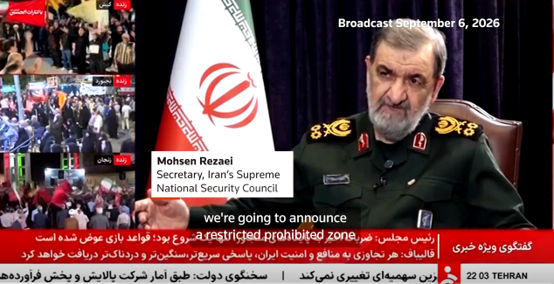
• Iran Prepares "Exclusion Zone": Iran's Supreme National Security Council announced plans to establish a "restricted navigation zone" across the perimeter of the Strait of Hormuz and sections of the Persian Gulf, warning that unauthorized vessels entering the zone will face blacklisting.
• U.S. Maintains Strait Patrols: The U.S. Secretary of Energy stated that over 9 million barrels of oil equivalent continue to transit the strait and surrounding pipelines daily, underscoring that the U.S. military remains committed to securing commercial transit.
2. 30-Minute Candlestick Chart Analysis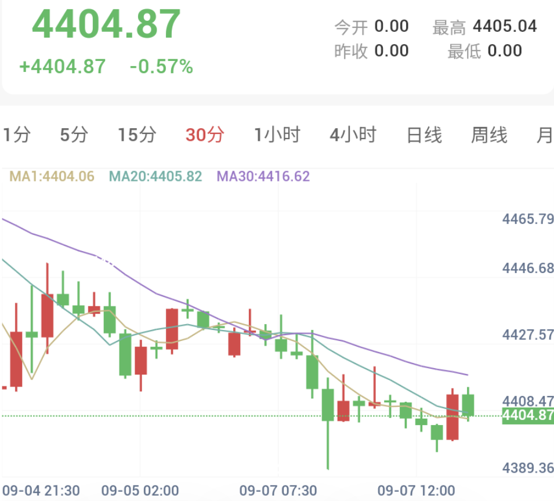
As of 13:40 Beijing time, spot gold traded at $4,404.87/oz, down 0.57% (a drop of $25.13) intraday.
During early trading, gold attempted to stabilize horizontally near $4,430. However, due to a severe absence of bullish follow-through and thin liquidity caused by the U.S. Labor Day holiday, the price entered a slow, stepped downward drift.
In terms of moving averages, the MA30 ($4,416.62) maintained a steady decline, forming an insurmountable dynamic ceiling intraday. The MA1 ($4,404.06) and MA20 ($4,405.82) converged tightly around $4,404. Price action is currently hugging this moving average cluster, repeatedly testing the pivotal $4,400 psychological support zone.
3. 30-Minute Technical Indicators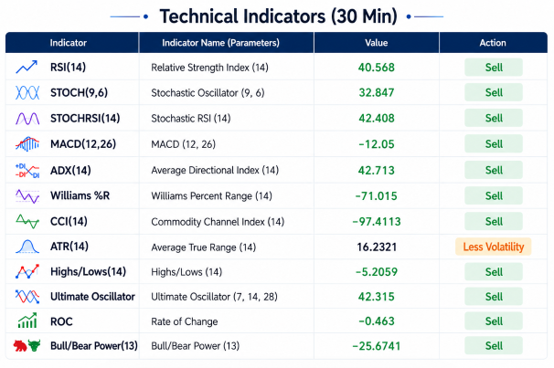
On the 30-minute timeframe, technical indicators reflect an overwhelming "Strong Sell" posture (0 buy, 0 neutral, 11 sell), indicating absolute short dominance in the immediate term:
• Trend and Momentum Diverge Bearishly: The MACD(12,26) stands at -12.05, continuously flashing sell signals. The ADX(14) trend strength indicator sits at 42.71 with a sell recommendation, reflecting strong institutional persistence behind the downward move.
• Core Oscillators Confined to Bearish Territory: The Relative Strength Index RSI(14) reads 40.56, held firmly below the 50 centerline. The CCI(14) sits at -97.41, signaling a strong sell, while the STOCH(9,6) registers at 32.84 in the lower weak range.
• Sensitive Oscillators Approach Oversold Boundaries: The fast StochRSI(14) records 42.40, and the Williams %R reads -71.01, both issuing sell signals. Confluent indicator readings confirm heavy selling pressure; a decisive breach below $4,400 could unlock further downward acceleration toward deeper support zones.
4. Summary
Overall, Friday's blowout U.S. August NFP report (surging by 162,000) shattered recession narratives and raised September Fed rate hike probabilities back to roughly 60%. Simultaneously, weekend escalations in the Middle East and Iran's proposed maritime exclusion zone pushed benchmark energy prices higher. These elevated energy costs present a renewed risk of secondary inflation, reinforcing the Fed's stance to maintain restrictive interest rates and serving as the primary macro headwind for gold.