

Trading Execution Plan
Based on multi-timeframe technical indicators remaining neutral and no clear market direction established, intra-day operations suggest a fade-highs short strategy:
Strategy Direction: Fade highs to short (momentum trade)
Trade Signal: Sell
Confidence Index: 65/100
Entry Range: 3970.00 - 4065.00
Range Midpoint: 4017.50
Stop-Loss Protection: 4084.24
Target Take-Profit: 3884.02
Risk-Reward Ratio: 1:2.00
I. Fundamental Analysis
Middle East Shipping Tensions Flare Up Again:
The UN International Maritime Organization (IMO)'s Hormuz Strait evacuation plan, initiated on Tuesday, was urgently suspended on Thursday. A Singapore-flagged cargo ship was attacked in waters near Oman, damaging its bridge. US officials attributed the attack to Iran.
Iran's Persian Gulf and Sea of Oman Shipping Authority (PGSA) subsequently issued a statement claiming the vessel deviated from designated routes without authorization, holding the shipowner and captain responsible. Iran emphasized that all vessels must pre-report and coordinate before transiting the Strait. Impacted by this geopolitical event, Brent crude prices rebounded nearly 2% yesterday.
Inflation Data Upside Fuels Rate Hike Expectations:
US Commerce Department data released Thursday showed US May PCE Price Index rose 4.1% YoY, with Core PCE up 3.4% YoY—both hitting stage highs.
Meanwhile, consumer spending jumped 0.7% MoM. Driven by elevated inflation readings, market odds for a 25bps Fed hike in September have surged to 80%.
Labor Market Remains Resilient Overall:
US Labor Department data showed initial jobless claims for the week ending June 20 fell to 215K, well below the expected 225K; continuing claims hit 1.821M, indicating a steady labor market that supports the Fed's case for sustained high rates or further tightening.
II. Multi-Timeframe Technical Analysis
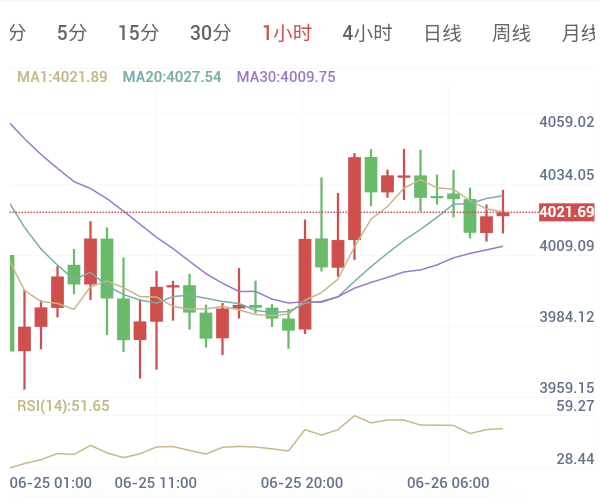
1-Hour Timeframe (Intra-Day Short-Term: Neutral)
Trend Assessment: 1H direction remains neutral. Price is ranging in a short-term oscillation zone, with upside momentum easing overall and lacking clear trend breakout.
Indicator Monitor: RSI at 51.65—low intra-day short-term volatility levels.
Daily Timeframe (Medium-to-Long-Term Trend: Neutral)
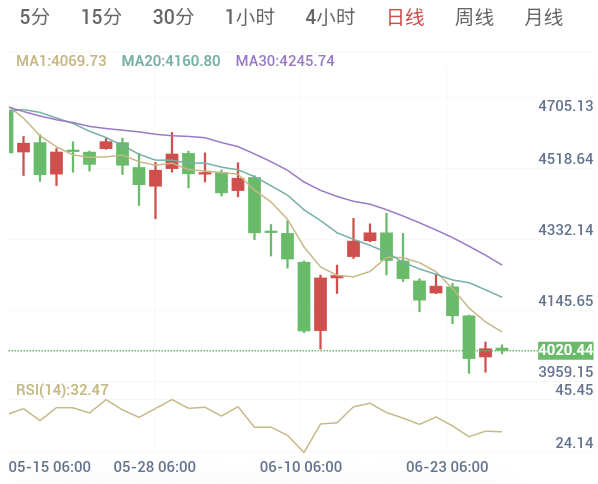
Trend Assessment: Daily macro direction stays neutral. Medium-term bearish pressure persists in the larger structure, with price in weak oscillation near oversold; long-term downside pull not fully dissipated.
Indicator Monitor: RSI at 32.47—near oversold threshold.
III. Core Key Price Levels
Upper Key Resistance: 4050.00 - 4080.00 (Intra-day oscillation upper edge and resistance band)
Lower Key Support: 3900.00 - 3950.00 (Medium-to-long-term critical technical support and defense zone)
[Execution Details]
Position Management:
Given the lack of directional convergence across timeframes and elevated risk of intra-day choppy whipsaws, strictly avoid heavy positioning. Keep overall exposure low to effectively control risk.
Emergency Risk Control:
Lock 4084.24 as the intra-day hard risk redline. If price surges abnormally and breaks above this level forcefully, it signals short-term bearish structure breakdown—all shorts must be unconditionally stopped out decisively and shift to sidelined observation. If price fails to reach the entry range, remain flat and wait.
Risk Disclaimer
Trading markets involve unpredictable risks, including but not limited to principal loss. This analysis is for reference only and does not constitute direct investment advice. Investors should make independent judgments and decisions based on their own risk tolerance.