

Trump Meets Multiple Foreign Leaders in Washington
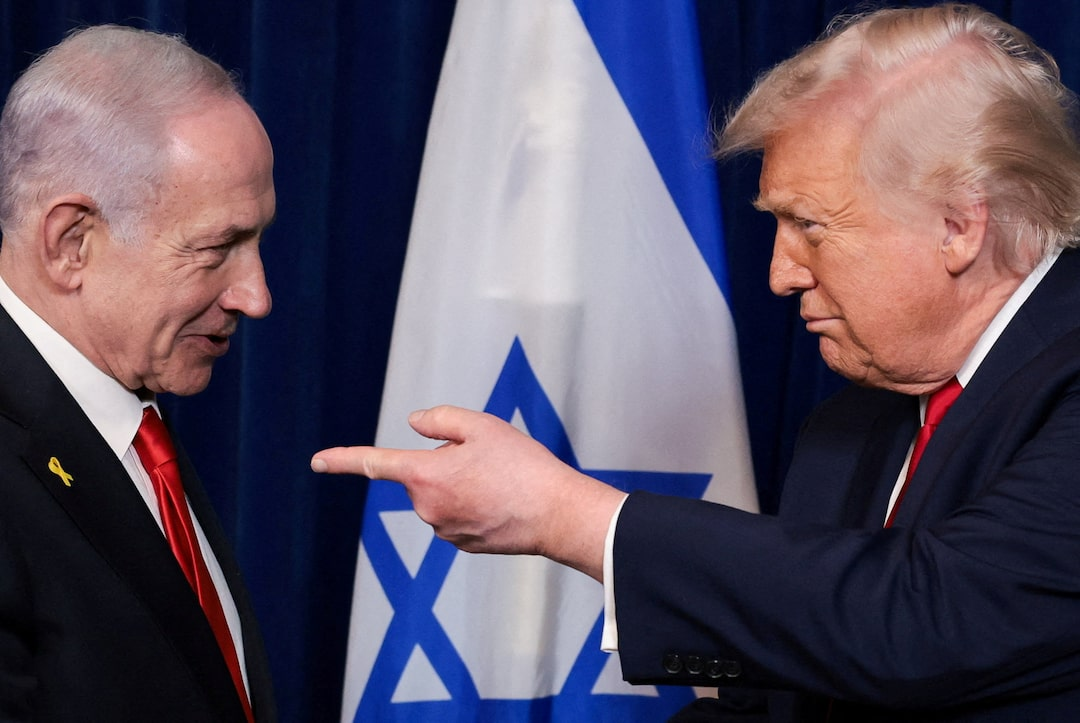
On Tuesday, Washington hosted an intensive series of high-level diplomatic meetings. US President Donald Trump met in Washington with Israeli Prime Minister Benjamin Netanyahu and Ukrainian President Volodymyr Zelenskyy as both Middle Eastern tensions and the conflict in Ukraine remain at critical junctures.
Regarding US-Iran friction, following previous setbacks in ceasefire agreements, President Trump stated that the US military has paused airstrikes against Iranian targets, attempting to create tactical space for diplomatic re-engagement. Prime Minister Netanyahu's visit, beyond attending commemorative events, aims to hold in-depth consultations with Trump regarding Middle Eastern security, while President Zelenskyy seeks US backing for air defense equipment and defense cooperation.
Although diplomatic contacts are advancing in Washington, the ultimate trajectory of geopolitical developments remains uncertain. The temporary suspension of US airstrikes places regional geopolitics into an observation phase.
Gold Prices Probe Lower as Moving Averages Align in Bearish Formation
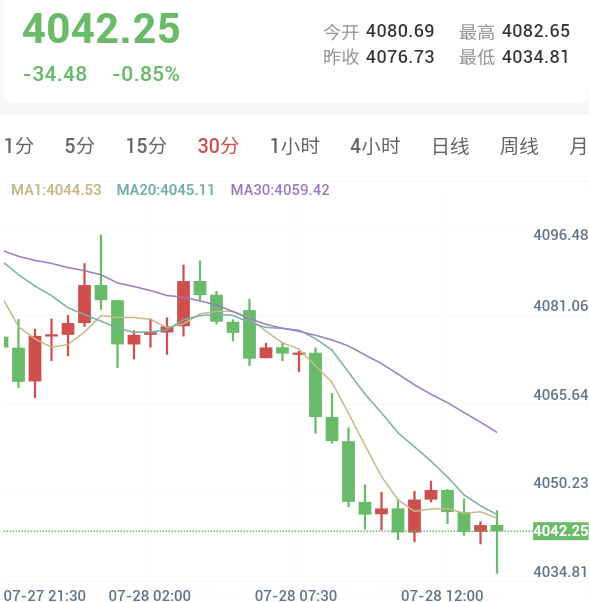
As of approximately 13:48 Beijing time on July 28, spot gold traded at $4,040.55 per ounce, down 0.89% intraday (losing $36.18) as price action staged a smooth pullback from early morning highs.
Early Rally Encounters Overhead Resistance: Gold opened today at $4,080.69 per ounce. Early buyers attempted an upward push to touch an intraday high of $4,082.65 per ounce. However, heavy overhead selling pressure above $4,080 caused prices to reverse rapidly after peaking.
Afternoon High-Volume Plunge: Beginning at 11:00 AM Beijing time, concentrated selling pressure erupted. Candlesticks printed consecutive bearish red bars, slicing through key psychological support levels at $4,070, $4,060, and $4,050 to set an intraday low of $4,034.81 around 13:30 before entering weak sideways consolidation.
Moving Average Alignment Exerts Downward Pressure: On the 30-minute chart, the MA1 ($4,044.19) and MA20 ($4,044.94) have crossed beneath the downward-sloping MA30 ($4,059.34). All three moving averages display a downward bearish divergence pattern, hovering firmly above current price action to establish an intraday resistance zone between $4,045 and $4,060.
30-Minute Technical Indicators Signal Strong Sell amid Localized Oversold Conditions
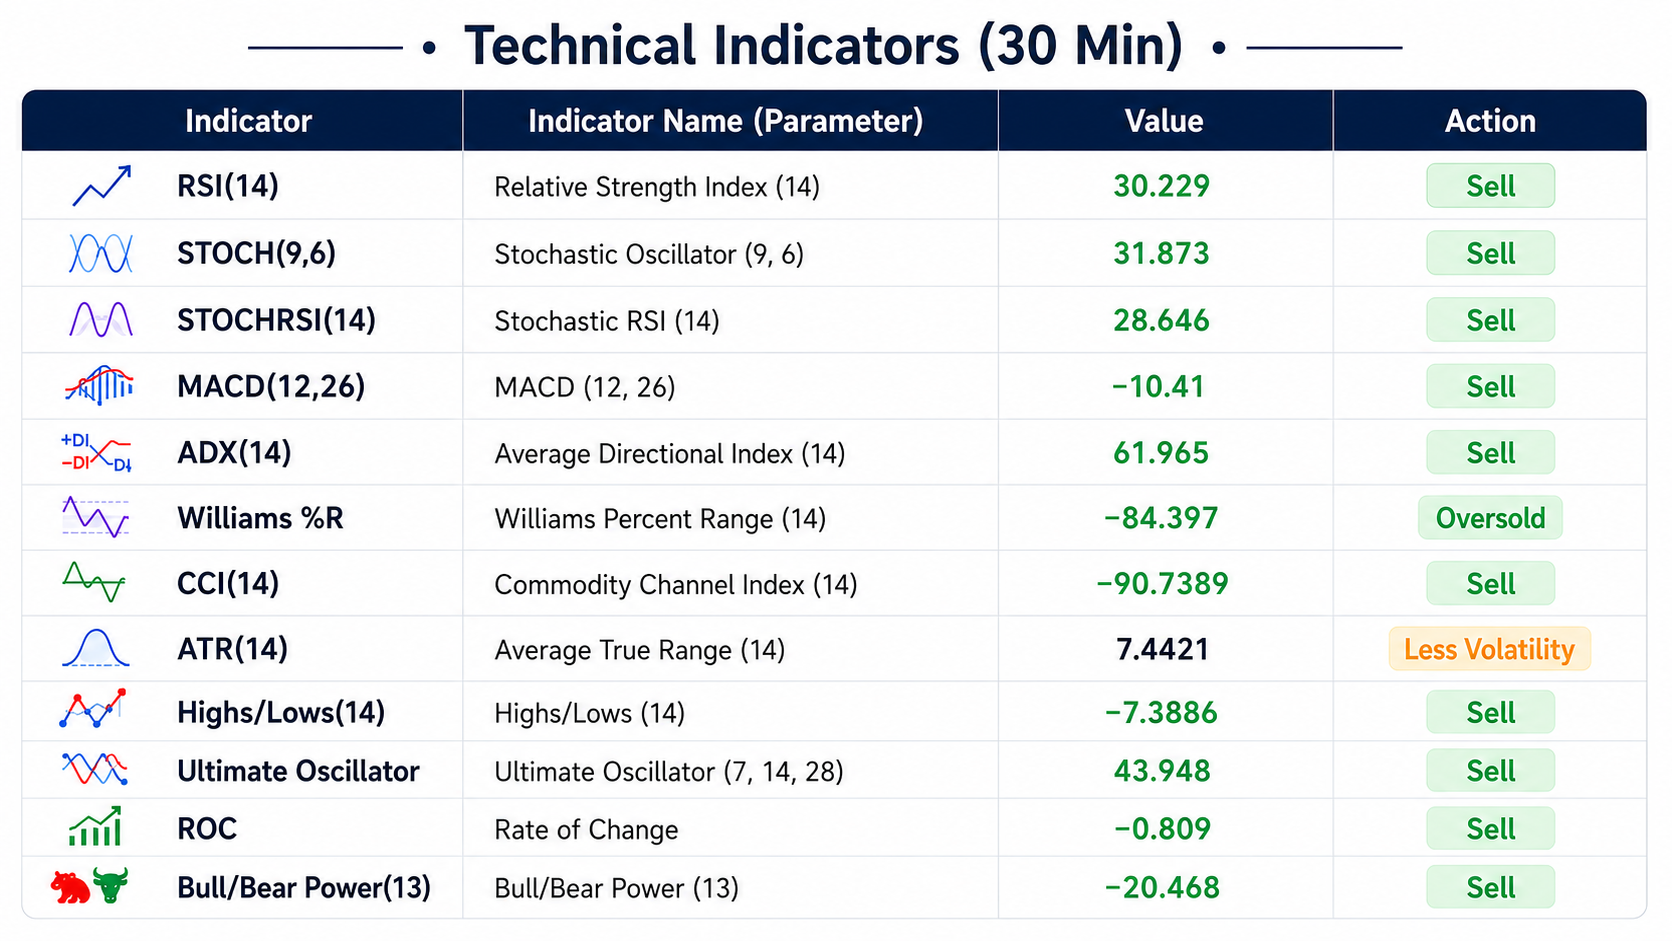
According to 30-minute technical indicator data as of 13:48, gold's $40 intraday drop shifted overall technical ratings to a Strong Sell (0 bullish metrics, 0 neutral, 10 bearish), with short sellers maintaining firm dominance.
Core Oscillators Touch Oversold Territory: The Relative Strength Index RSI(14) plummeted to 30.229, the Stochastic STOCH(9,6) registered 31.873, the Stochastic RSI Fast read 28.646, the Commodity Channel Index CCI(14) stood at -90.7389, and the Williams Percent Range printed -84.397. All sensitive oscillators dipped into oversold territory, indicating that short-term panic selling has been largely absorbed following the rapid drop.
Trend Momentum Metrics Retain Bearish Stance: The Average Directional Index ADX(14) recorded a high reading of 61.965 alongside active sell signals, confirming strong directional trend momentum behind the intraday decline. Medium-term direction indicator MACD Level stands at -10.41 in sell posture, while Bull/Bear Power reads -20.468, confirming that overall price action remains governed by a downward channel.
Future Outlook for Gold
In summary, the gold market today is primarily influenced by high-level diplomatic meetings in Washington and the geopolitical observation period ushered in by the suspension of US airstrikes.
From a technical standpoint, moving averages on the 30-minute chart exhibit a downward bearish divergence, with price action consolidating at lower levels near $4,040.55 per ounce. Technical indicators reflect a combination of strong directional downward momentum (ADX at 61.965) alongside localized oversold conditions (RSI at 30.229).